HTC with PanEvolution/PanPrecipitation
In this example, we will demonstrate how to find the peak yield strength of the AA6005 alloy with varying both composition and heat-treatment temperature.
-
Load proper thermodynamic + mobility database and select Al, Mg, Si three components.
-
Load proper kinetic-parameter database to select the matrix phase and precipitates.
-
Choose the HTC function from the menu Batch Calc → High Throughput Calculation (HTC).
-
Choose the calculation type from the drop-down list of HTC pop-up window and select “Precipitation”.
-
Define the compositional space for HTC simulation. As shown in Figure 2, the compositions of Mg and Si varying within the ranges of 0.4-0.6, and 0.6-0.9 (wt.%), respectively.
-
Define the thermal history for HTC simulation. User can define/import one thermal history by using the “Thermal History” dialog in Figure 2 or select the “Load C. Curve” and click the “Import CC” button to browse and load the predefined cooling curves (.txt or .dat). The example format of cooling curve file can be found in Figure 1 in Section HTC in Console Mode. In this example, isothermal aging for 20 hours at three temperatures 190, 182, and 170°C are defined individually in the loaded curve file. It is noted that only one thermal history can be typed in through GUI, while more than one thermal history can be considered through using the cooling curves file.
-
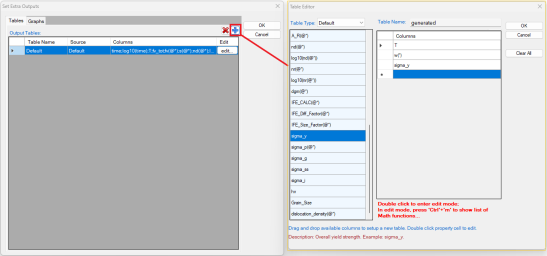
In addition to use the default output, user can also customize the outputs using the “Extra Outputs” function shown in Figure 2. Then another window (Figure 3) will pop-up for setting the extra outputs. In this example, the extra output with time, T - temperature, w(*) - alloy composition, and sigma_y (yield strength) is generated.
-
After setup the compositional space for HTC and define/import the proper thermal history, user can click “Run HTC” button to perform HTC simulations.
-
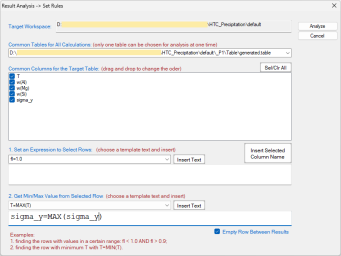
Save the current workspace after all calculations are finished and run “Result Analysis” from the “Batch Calc” menu. User can use this commend to analyze the calculated results for a group of alloys and pick a certain property from each calculation for comparison. As shown in the following Figure 4, the following rule is used to obtain the maximum yield strength of each alloy under thee different heat-treatment conditions.
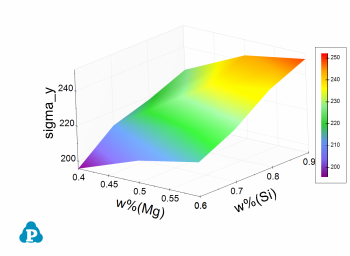
Figure 5 shows the obtained peak yield strength distribution within the defined composition space considering all three heat treatment conditions. User can run “Result Analysis” on this save workspace and dig out more information using other rules. For example, user can plot peak yield strength distribution in the composition space for one particular heat treatment condition.


