TTT diagram of Ni-14Al (at%) Alloy
Purpose: Learn to calculate the TTT curve for a given alloy.
Module: PanEvolution
Thermodynamic and Mobility Database: AlNi_Prep.tdb
Kinetic Parameters Database: Ni-14Al_Precipitation.kdb
Batch file: Example_#3.2.pbfx
Calculation Procedures:
-
Create a workspace and select the PanEvolution module following Pandat User's Guide: Workspace ;
-
Load AlNi_Prep.tdb following the procedure in Pandat User's Guide: Load Database;
-
Click on PanEvolution/PanPrecipitation on the menu bar and select "Load KDB or EKDB", then select the Ni-14Al_Precipitation.kdb;
-
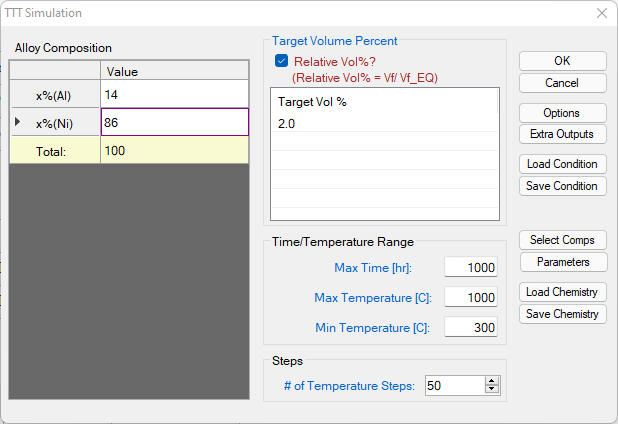
Click on PanEvolution/PanPrecipitation on the menu bar and click "TTT Simulation". A dialog will pop out as shown in Figure 1, In this dialog, user needs to input the alloy chemistry (left), temperature range and step (bottom right) and the Target volume fraction (top right). If the “Relative Vol%” box is checked, it means the Target Vol% is relative to the equilibrium fraction of the precipitate phase at each temperature, otherwise it is the volume fraction of the precipitate phase.
Post Calculation Operation:
-
Change graph appearance following the procedure in Pandat User's Guide: Property;
Information obtained from this calculation:
-
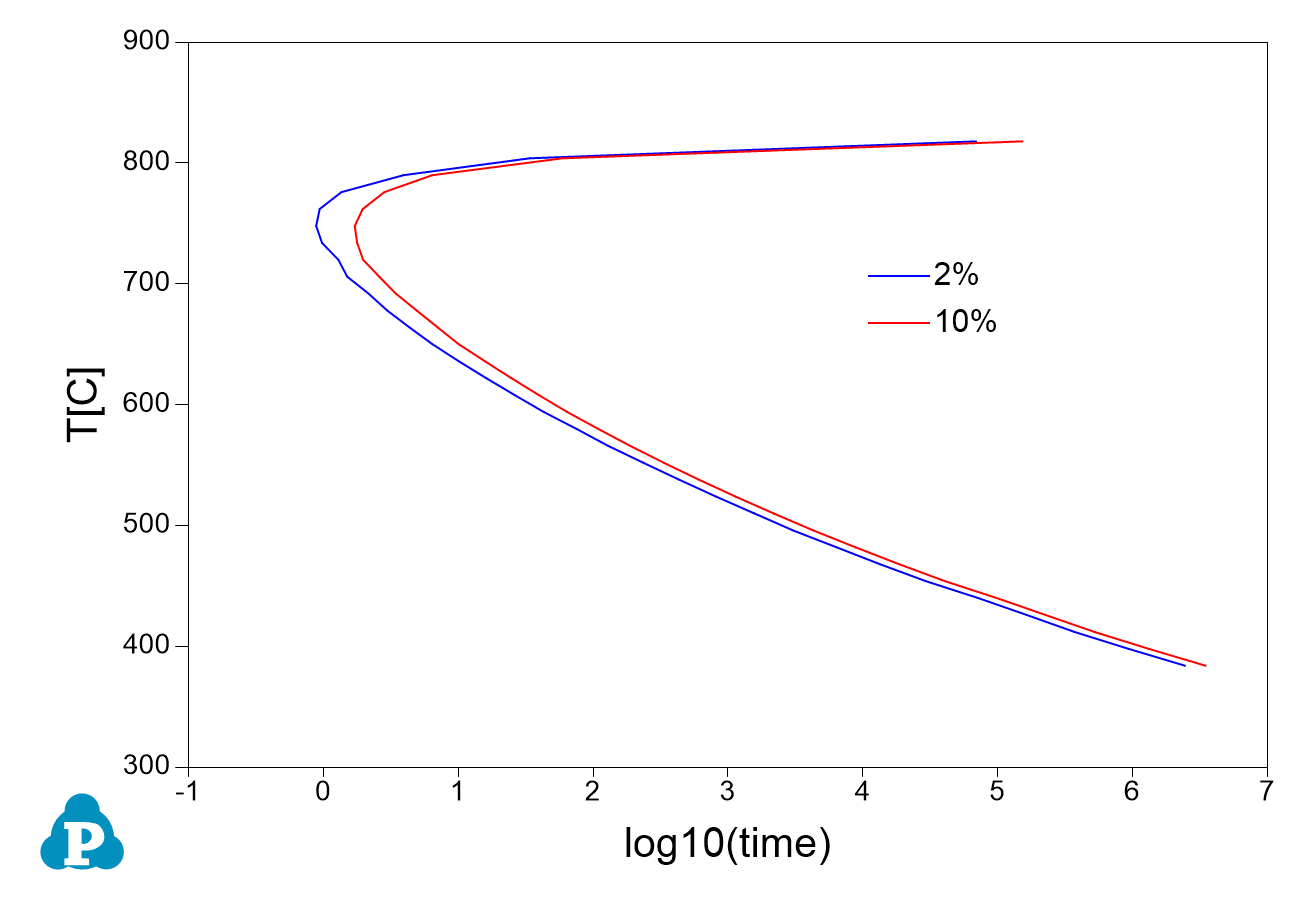
Figure 2 shows the default plot from the calculation. It should point out that this TTT curve represents the time-Temperature curve when 2% of the equilibrium precipitate at each temperature comes out. For example, the equilibrium fraction of L12_FCC precipitate phase is 16.56% at 650°C, 2% of it is 0.33%. In other words, it takes 6.5 second to precipitate 0.33% of L12_FCC at this temperature.
-
Perform another calculation for 10% and merge the two plots as shown in Figure 3;
-
Details on the time, temperature and fraction of precipitate can be found in the Default table;