Tutorial
Create a PanSolidification Project
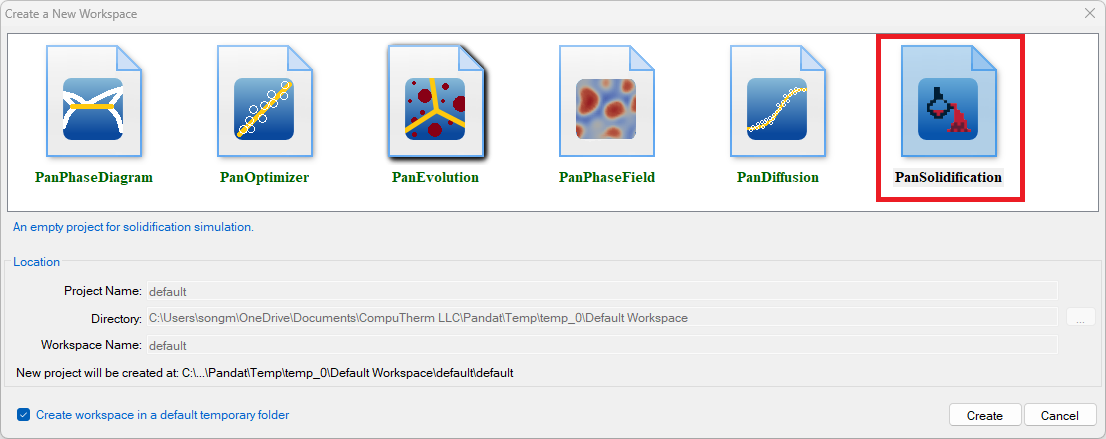
user can create a PanSolidification project through menu “File → Create a New Workspace” or “File → Add a New Project” in an existing workspace. The “Module Window” pops out for user to choose a module for the new project as shown in Figure 1. Choose “PanSolidification” module and then click on Create button or double click on the PanSolidification icon, then a PanSolidification project will be created.
Load Thermodynamic and Mobility Database
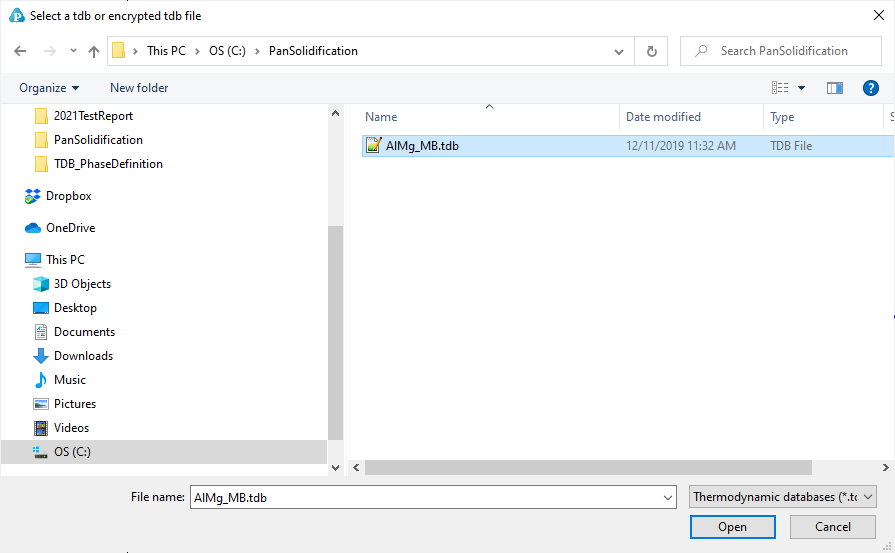
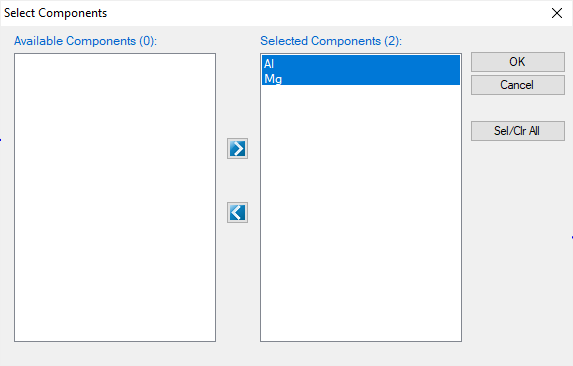
The next step is to load the database, which is MgAl.tdb in this example. Different from the normal thermodynamic database, this database also contains mobility model parameters for the phases of interest in addition to the thermodynamic model parameters. Both are needed for carrying out solidification simulation. By clicking the ![]() button on the toolbar, a pop-up window as shown in Figure 2 will open, allowing user to select the database file. And Click “Open” to select the database, then a window as Figure 3 will pop up for user to select components for PanSolidification simulation.
button on the toolbar, a pop-up window as shown in Figure 2 will open, allowing user to select the database file. And Click “Open” to select the database, then a window as Figure 3 will pop up for user to select components for PanSolidification simulation.
Load Solidification Kinetic Database
A solidification kinetic database is required for solidification simulation. Such a database contains kinetic parameters which are alloy dependent. To organize these parameters in a more intuitive way, the standard XML format is adopted and a set of well-formed tags are deliberately designed to define back diffusion model for the morphology of primary phase (which could be plate, cylinder and sphere) and its corresponding model parameters such as interfacial energy, latent heat, coarsening geometric factor, dendrite tip factor, solute trapping parameter, solid diffusivity factor and boundary layer factor.
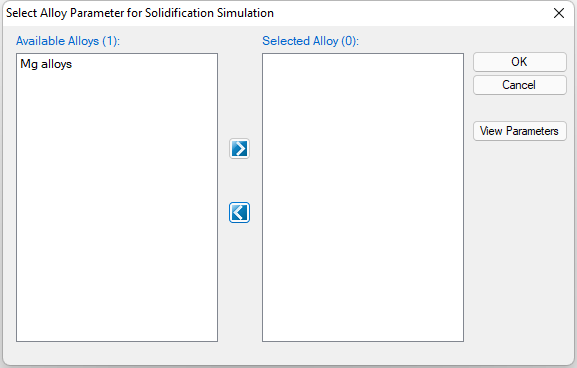
In this example, the MgAlloys.sdb is prepared. To load a solidification database, user should navigate the command through menu "PanSolidification → Load SDB", or click icon ![]() from the toolbar. After MgAlloys.sdb is chosen, a dialog box pops out automatically for user to select the alloy for the simulation. As shown in Figure 4, Mg alloys is contained in this SDB file.
from the toolbar. After MgAlloys.sdb is chosen, a dialog box pops out automatically for user to select the alloy for the simulation. As shown in Figure 4, Mg alloys is contained in this SDB file.
Solidification Simulation
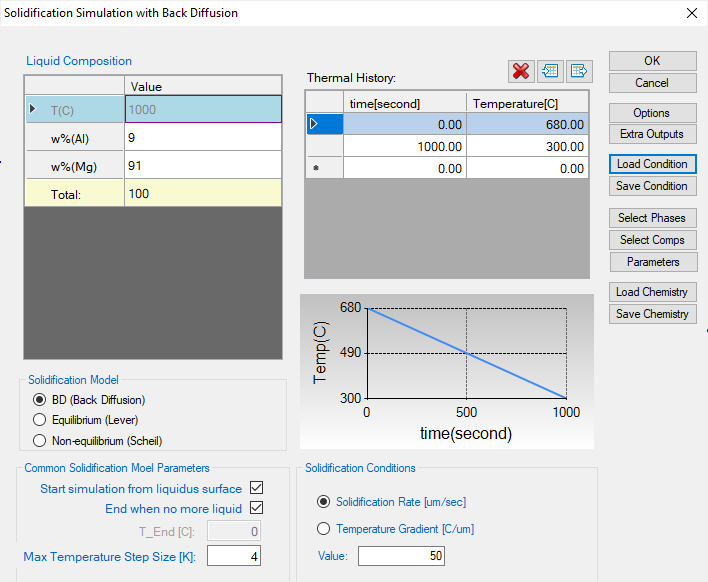
Perform solidification simulation through menu bar "PanSolidification → Solidification Simulation" with Back Diffusion or click icon ![]() from the tool bar. As shown in Figure 5, a dialog box entitled “Solidification Simulation with Back Diffusion” pops out for user’s inputs to set up the simulation conditions: alloy composition and solidification conditions. When setting the solidification conditions, user need to be careful about the units used for the conditions. user can change the units by clicking on the "options" button. Please refer to Section Options about the options in detail.
from the tool bar. As shown in Figure 5, a dialog box entitled “Solidification Simulation with Back Diffusion” pops out for user’s inputs to set up the simulation conditions: alloy composition and solidification conditions. When setting the solidification conditions, user need to be careful about the units used for the conditions. user can change the units by clicking on the "options" button. Please refer to Section Options about the options in detail.
-
Alloy Composition: User can set alloy composition by typing in or use the Load Chemistry function. User can also save the alloy composition through Save Chemistry. This is especially useful when working on a multi-component system, so that user does not need to type in the chemistry every time.
-
Solidification Conditions: The Cooling Rate (CR) of solidification can be defined through Thermal History window. The cooling rate determined by cooling curves can also be imported by click the icon
 as shown in Figure 5. The Solidification Rate (V) and Temperature Gradient (G) can be defined from this interface. As these parameters have a relationship of CR = G*V, user may choose to provide either Solidification Rate or Temperature Gradient.
Customize Simulation Results
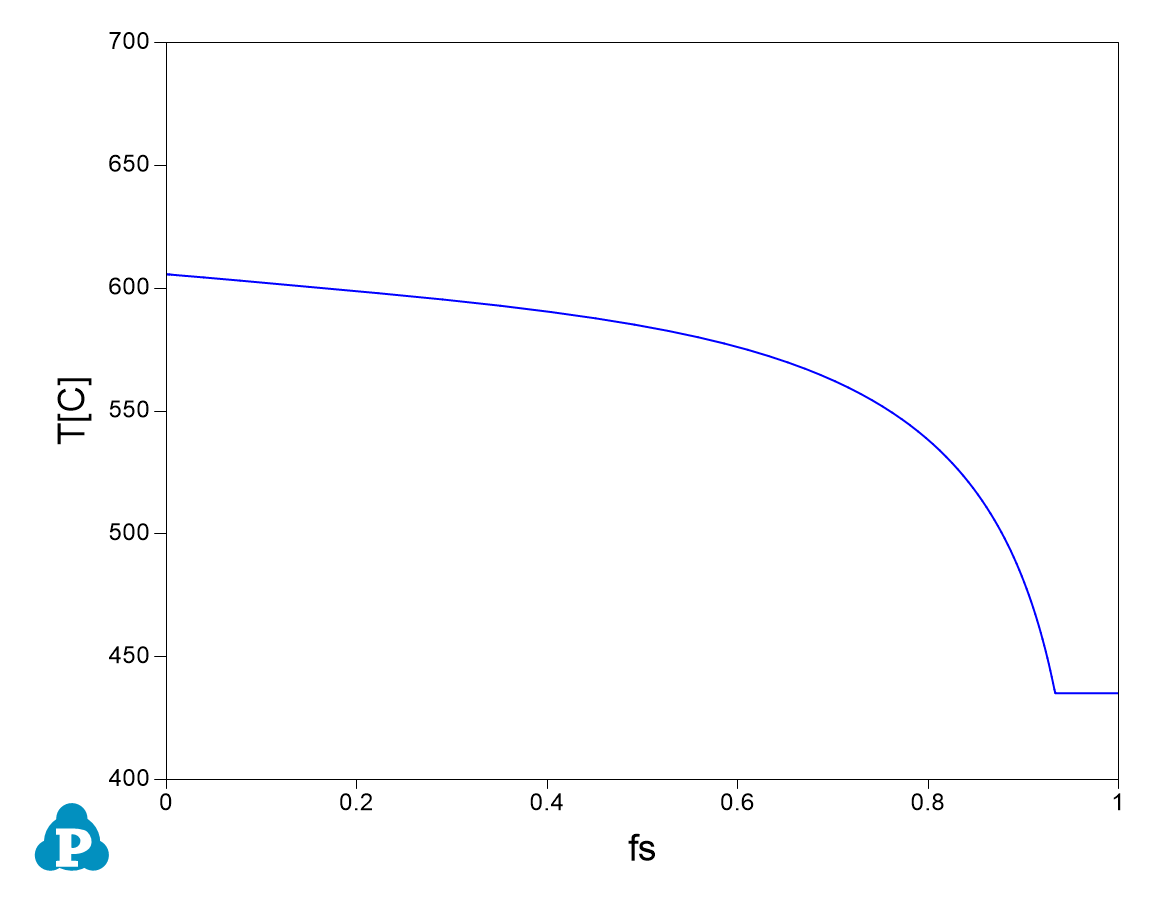
As all other calculations available in Pandat™, upon the completion of the solidification simulation, a default table with related solidification related properties (time, temperature, secondary dendrite arm spacing, solid and liquid phase fractions, etc.) is automatically generated and a default graph for temperature (T) vs solid fraction (fs) is displayed as shown in Figure 6. User can refer to Section Graph and Section Table to learn how to customize simulated graph and table.