Table Column Operations
When creating a new table in Pandat, user can select the properties listed in the left column and drag them to the right column as shown in Figure 1 in Section Icons for Table on Toolbar. Pandat allows user perform algebraic calculations and simple logic operations on the properties and create a customized table.
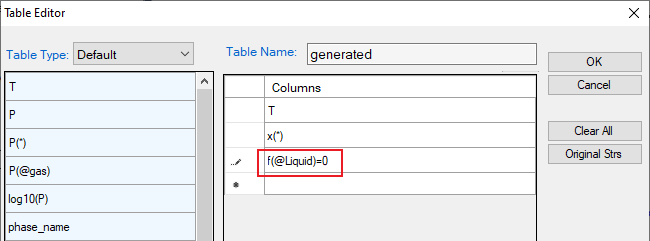
Table 1 and Table 2 in Section Mathematical Functions and Operationslist the mathematical algebraic functions available for table column expressions with examples. Nested functions are also allowed. Table 3 in Section Mathematical Functions and Operations lists the logical expressions that can be used to extract a set of specific data from Pandat calculation results. These expressions can be applied to default table or other types of tables obtained from the calculation results. For example, user needs the first melting temperatures after a section calculation. A constraint can been easily set as “f(@Liquid)=0”. Multiple constraints can be realized by setting one constraint in a row in the Table Editor shown in Figure 1 in Section Icons for Table on Toolbar.
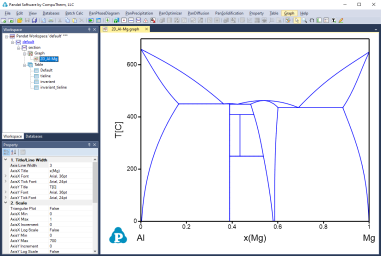
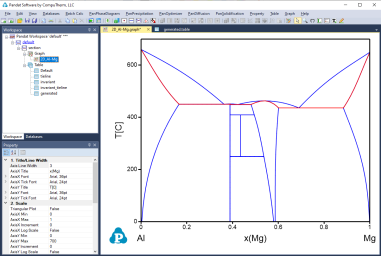
Here an example is given to demonstrate how to use the logical expression to obtain useful information from the calculated results. Figure 1 shows the calculated Al-Mg binary phase diagram. After the calculation, a table is generated with the constraint of f(@Liquid)=0, as seen in Figure 2. The new generated table is shown in Figure 3, which is a subset of the phase boundaries of Al-Mg where liquid phase exists and has phase fraction of zero, the so-call “first melting” boundary. This set of boundaries can be plotted on the Al-Mg phase diagram following the approach in Section Graph. The first melting line is shown in red as in Figure 4. More examples will be presented in Section Table Column Functions


