Pressure-Composition-Temperature (PCT) Curve
A Pressure-Composition-Temperature (PCT) curve is a graphical representation of the relationship among pressure, composition (hydrogen concentration), and temperature of a material. It is typically used to evaluate the hydrogen storage capability of a metal alloy. The PCT curve illustrates the amount of hydrogen that can be absorbed or released at different pressures and temperatures. It is straightforward yet provides crucial information for guiding the design of hydrogen storage systems.
A function is developed in Pandat which allows a user to calculate the PCT curve by a few mouse-clicking.
Below is an example for calculating the PCT curve of the Ti-H system at 1273 K:
-
Navigate to the PanPhaseDiagram menu bar and select Line Calculation, or click the
 button on the toolbar.
 -
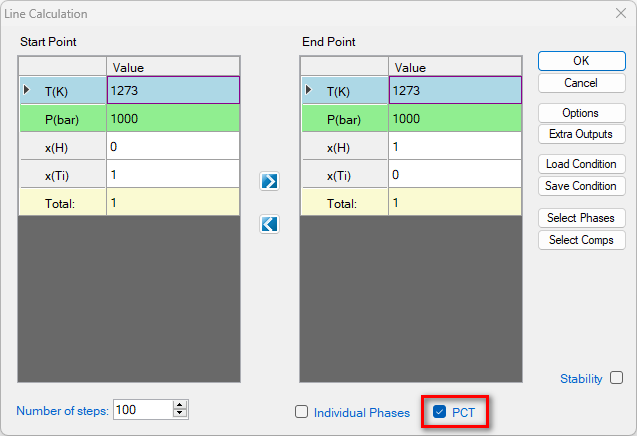
In the Line Calculation (1D) section, select the PCT curve calculation function, as shown inFigure 1. Set up the composition range from pure Ti to pure H, the temperature at 1273 K, and the total pressure of the system at 1000 Bar.
-
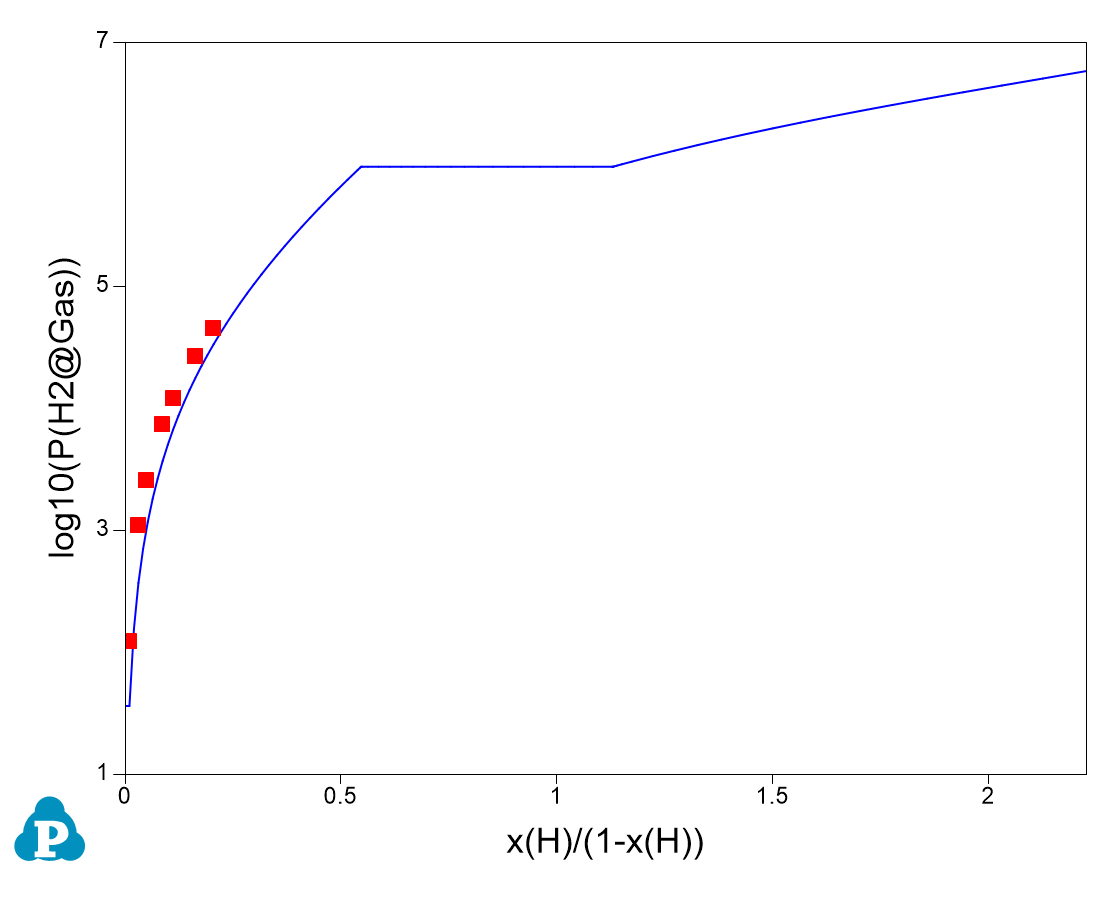
The calculated PCT curve under such conditions is shown in Figure 2. The experimental data are also plotted in the figure for comparison.