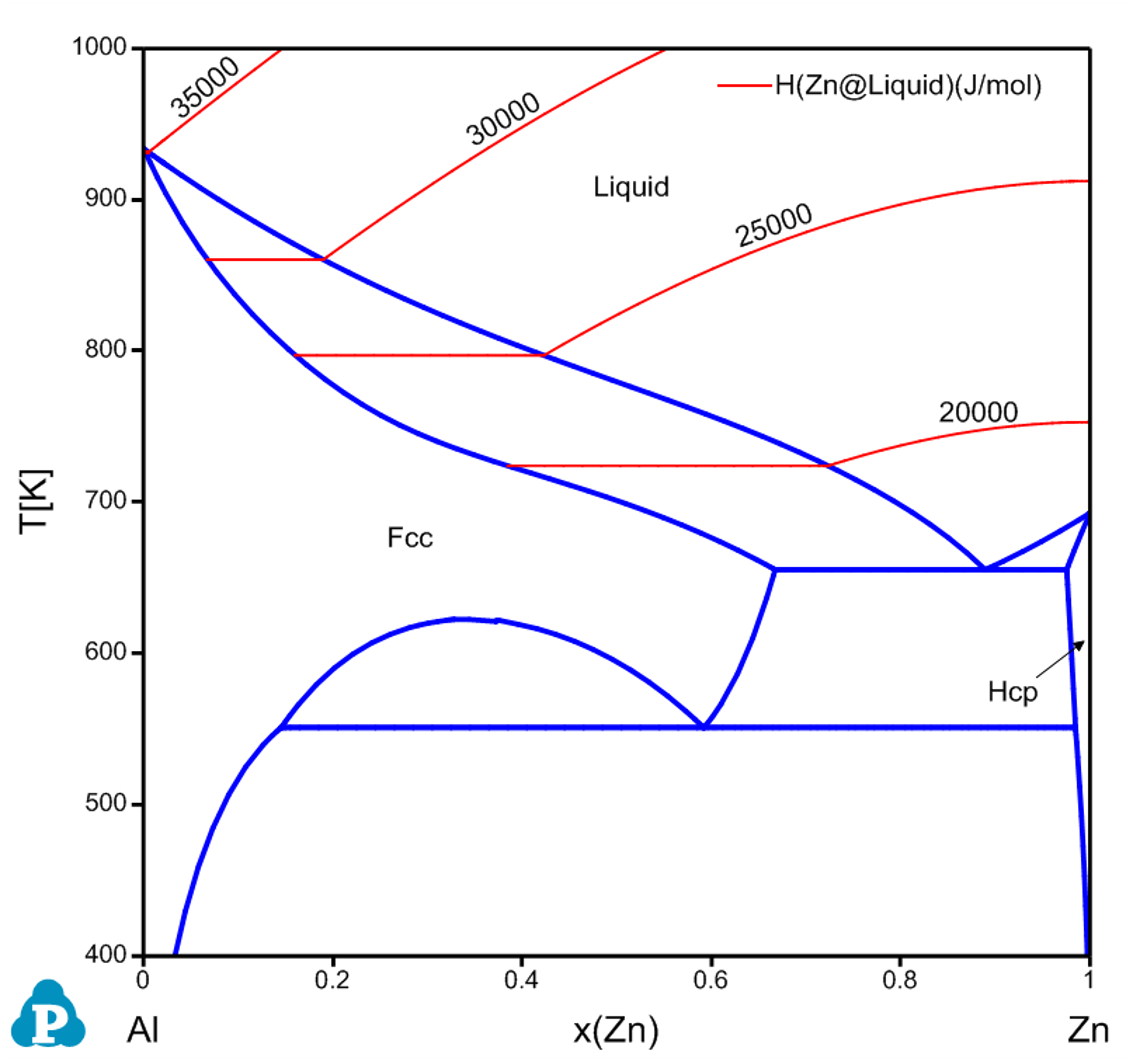
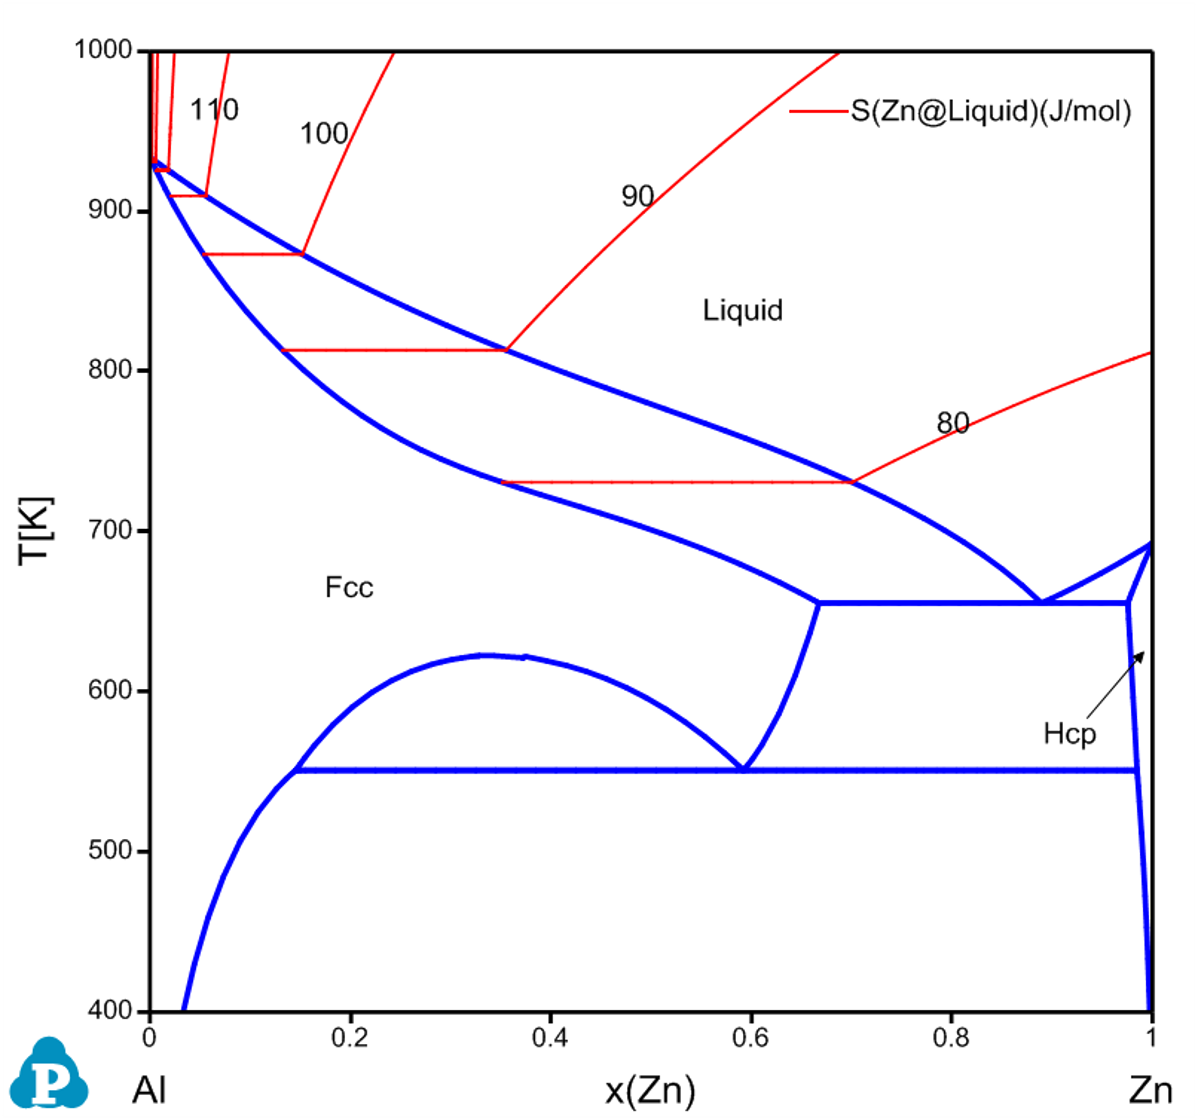
Partial Molar Property Diagram
Partial molar properties such as partial molar enthalpy and entropy of a component can also be calculated as a contour diagram along with the phase diagram. The red curves in Figure 1 and Figure 2 are the calculated contour curves of the partial molar enthalpy and entropy of Zn in the liquid phase for the Al-Zn system. The constraints in both calculations are f(@Liuid)>0 since the calculation is for the stable liquid phase only.