Partial Pressure Contour Diagram
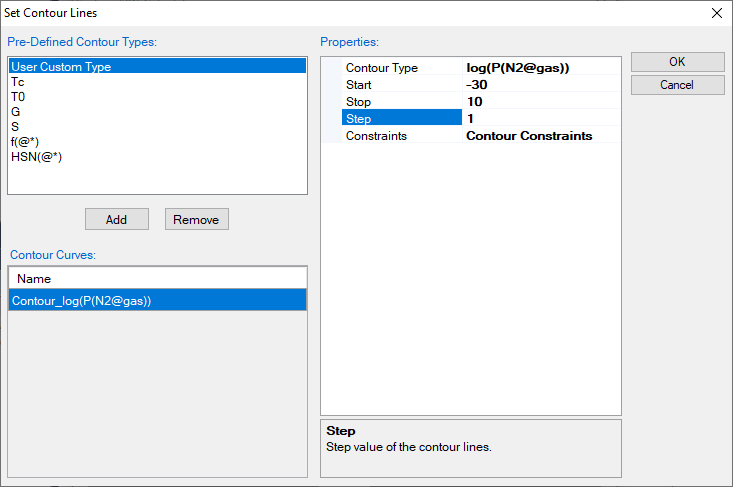
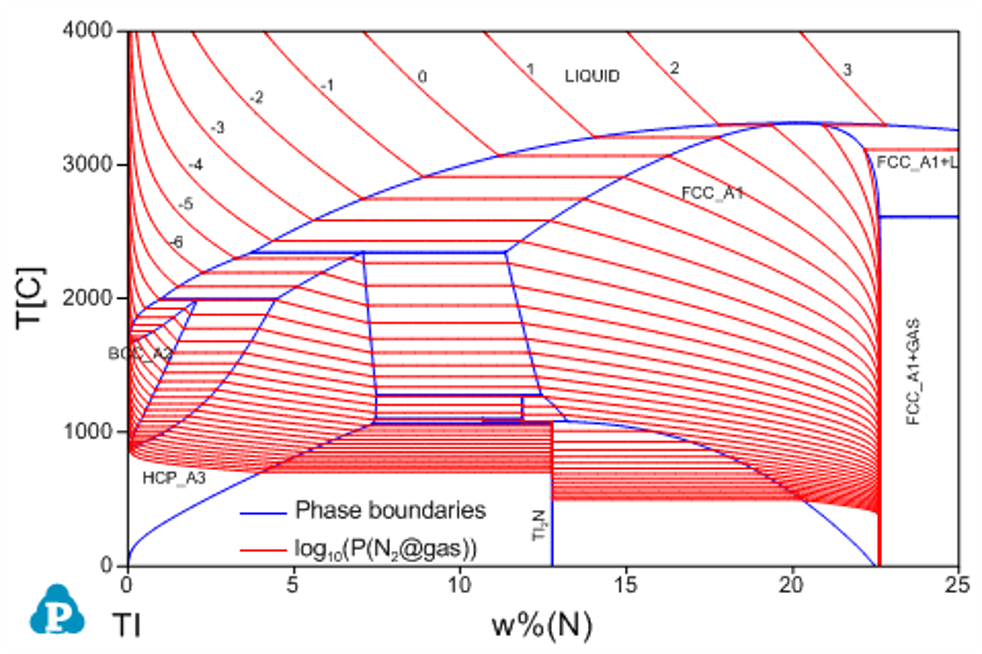
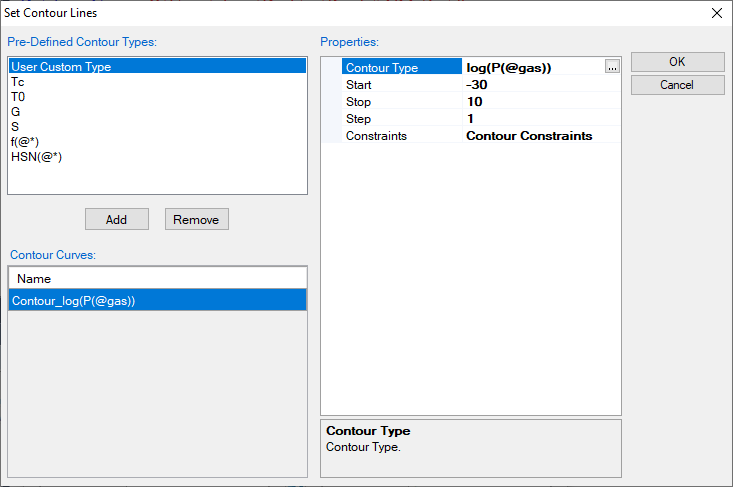
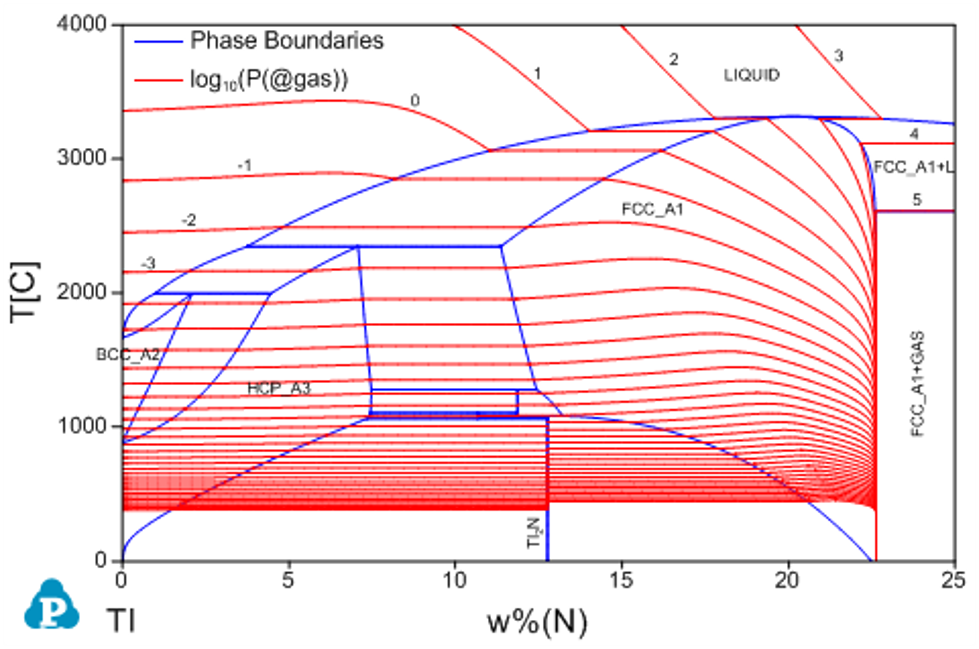
The following example shows how to calculate the contour lines for the partial pressure of the gas phase in the Ti-N system [1996Zen]. Figure 1 (a) is the input condition window and Figure 1 (b) is the calculated phase diagram of Ti-N with the contour lines of log(P(N2@gas)) (pressure unit is Pa), which is the common logarithm of the partial pressure of N2 in gas. Figure 1 (c) is another input condition window and Figure 1 (d) is the calculated phase diagram of Ti-N with the contour lines of log(P(@gas)), which is the common logarithm of the total pressure of gas with the gas species N, N2, N3 and Ti.
More examples can be found in the Pandat example folder: /PanPhaseDiagram/Contour/
|
(a) Input condition |
(b) log(P(N2@gas)) contour |
|
(c) Input condition |
(d) log(P(@gas)) contour |
|
Figure 1: Contour diagrams of partial pressure of gas in the Ti-N system |
|
[1996Zen] K. Zeng and R. Schmid-Fetzer, “Critical Assessment and Thermodynamic Modeling of the Ti-N System”, Z. Metallkd, 87 (1996): 540-554.