Tielines
A special column property name “tieline” is introduced to create a table of tielines from the calculated results. It can be combined with other column constraints to select a special set of tielines.
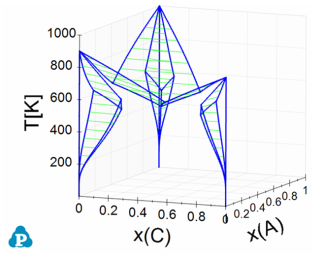
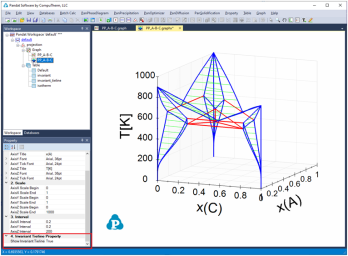
Figure 1 is a 3D ternary phase diagram calculated from the database file “ABC.tdb” which is provided in the PandatExamples folder. This system has three binary eutectic reactions. To show the invariant tielines in these binaries, set the “Show Invariant Tieline” in the Property window as “true”, then the invariant lines will be plotted on it as shown in Figure 2.
Figure 1: 3D phase projection of a simple ternary system with eutectic reaction in every binary system
Figure 2: 3D phase projection with three binary eutectic and one ternary eutectic tielines shown as red
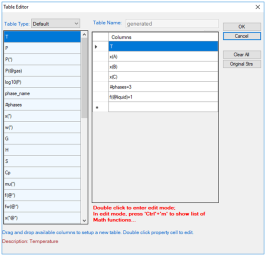
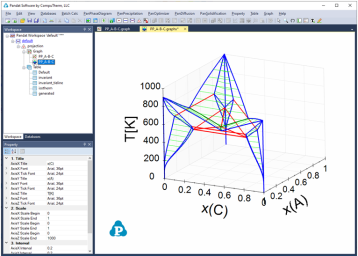
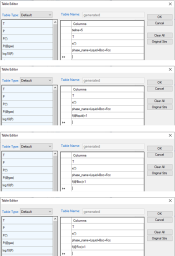
The ternary univariant lines (L+Bcc+Fcc, L+Bcc+Hcp, and L+Fcc+Hcp, red color) connects these reactions can be highlighted as follows. First, create a new table as shown in Figure 3. The purpose of the new table is to extract the boundary line(s) that connect Liquid, and the other two solid phases, and the fraction of Liquid on this boundary line is 1. After the table is created, select this new table in the Explorer window, and drag x(C) from the Property window to the Main Display window, and drop it as the x-axis; press “Ctrl” and then drag x(A) from the Property window to the Main Display window, and drop it as the y-axis; press “Shift” and then drag T from the Property window to the Main Display window, and drop it as the z-axis. This line showing the gradually change from the peritectic reaction to the eutectic reaction is then highlighted (green color), as shown in Figure 4.
Figure 4: The ternary univariant lines (dark green lines) connecting the invariant reactions in the binaries
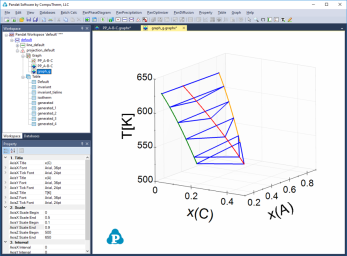
Figure 5 shows how to create 4 new tables to plot the 3D diagram in Figure 6, which shows the ternary three-phase equilibrium tie-triangle volume. The 4 tables include a set of the tie-triangles by setting its density as "tieline=5" and the phase lines for the liquid, Bcc, Fcc phases by setting the fraction of the corresponding phase to be 1.
