Concurrent Grain growth and precipitation Simulation of Ni-14at.%Al alloy
In this tutorial, the Ni -14 at% Al alloy is also used for concurrent grain growth and precipitation simulation in PanPrecipitation. The related batch file (Ni-14Al_Microstructure.pbfx), thermodynamic and mobility database ( AlNi_Prep.tdb ) and kinetic parameters database (Ni-14Al_Microstructure.kdb) can be found in the Pandat™ installation folder "\Pandat 2022 Examples\PanPrecipitation\Grain_Precipitation\":
Step 1: Create a Workspace
The same procedure as described in the previous tutorial Section Step 1: Create a Workspace
Step 2: Load Thermodynamic and Mobility Database
The same procedure as described in the previous tutorial Section Step 2: Load Thermodynamic and Mobility Database
Step 3: Load Kinetic Parameters Database (kdb file)
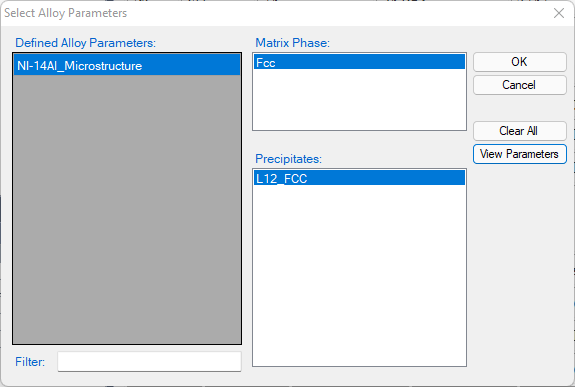
The procedure is similar to the description in the previous tutorial Section Step 3: Load Kinetic Parameters Database (KDB file). The "Defined Alloy parameters" in this kdb file is "Ni-14Al_Microstructure", as shown in Figure 1. It was "Ni-14Al_KWN" in the previous tutorial as shown in Figure 3.
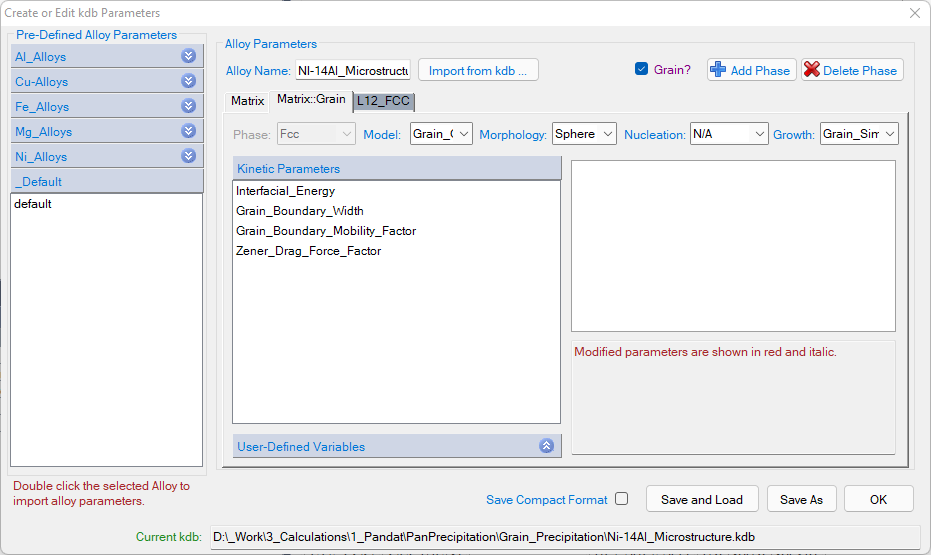
Click the “View Parameters”, the “Create or Edit kdb Parameters” dialog pops out as shown in Figure 2. The parameters in this kdb file contains not only the "matrix" phase and the "L12_Fcc" precipitate phase, but also the “Matrix:: Grain” parameters. Those “kinetic parameters” and some “User-defined Variables” are required for grain growth simulation.
Step 4: Concurrent Grain Growth and Precipitation simulation
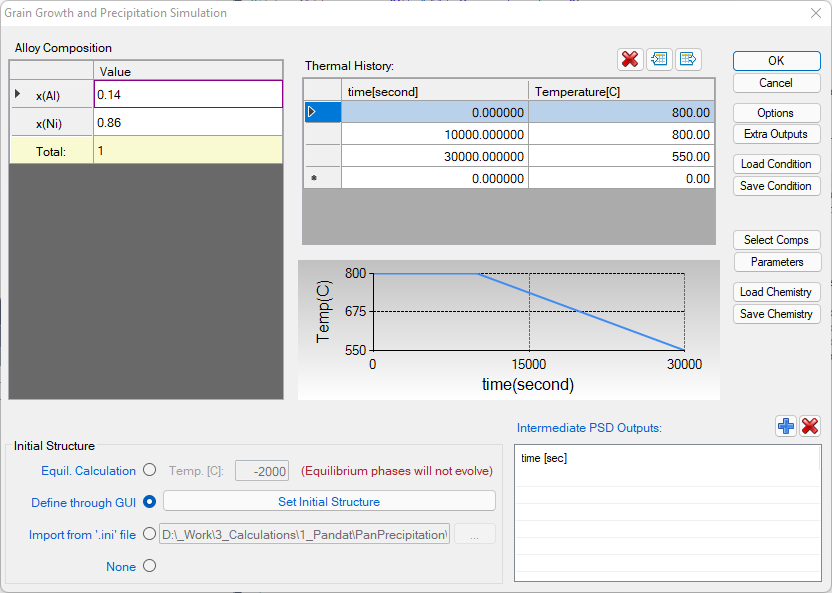
After successfully loading the thermodynamic and mobility database (TDB and PDB file) and the kinetic parameters database (KDB file), which contains kinetic parameters for both the matrix phase and precipitate phases, the function for grain growth and precipitation simulation is then being activated. To perform a concurrent grain growth and precipitation simulation, choose from Pandat™ menu “PanPrecipitation → Concurrent Grain Growth and Precipitation”, or click icon ![]() from the toolbar. A dialog box entitled “Grain Growth and Precipitation Simulation”, as shown in Figure 3, pops out for user’s inputs to set up the simulation conditions: alloy composition, thermal history and initial structure.
from the toolbar. A dialog box entitled “Grain Growth and Precipitation Simulation”, as shown in Figure 3, pops out for user’s inputs to set up the simulation conditions: alloy composition, thermal history and initial structure.
-
Alloy Composition: User can set alloy composition by typing in or use the Load Chemistry function.
-
Thermal History: Arbitrary heat treatment schedule can be inputted, with a linear Time-Temperature relationship (i.e., constant cooling or heating rate) at each two consecutive rows. Time at the first row must be zero representing the initial time. The thermal history set up in the Figure 3 represents an isothermal heat treatment for 10000 s at 800 °C, then constantly cooling to 550 °C within from 10000s to 30000 s. Multi-stages of heat treatment can be set by adding more rows in the Thermal History column.
-
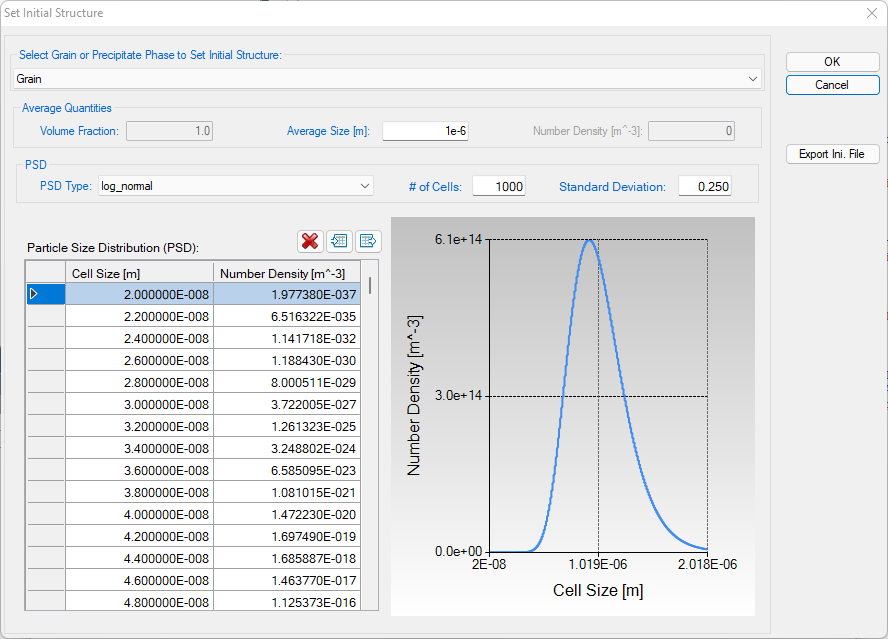
Set initial Structure: Users can set initial structure through the function “import from ‘.ini’ file” or “Define through GUI”. Click “Set Initial Structure”, the dialog as shown in Figure 4 pops out for users to set initial structure. From this dialog, users can set the initial structure for both the grain and precipitate phase. In this tutorial, the initial average grain size is set as 1e-6 m (1μm), with "log_normal" distribution. After setting the initial structure, click “Export Ini. File" to save the initial condition file.
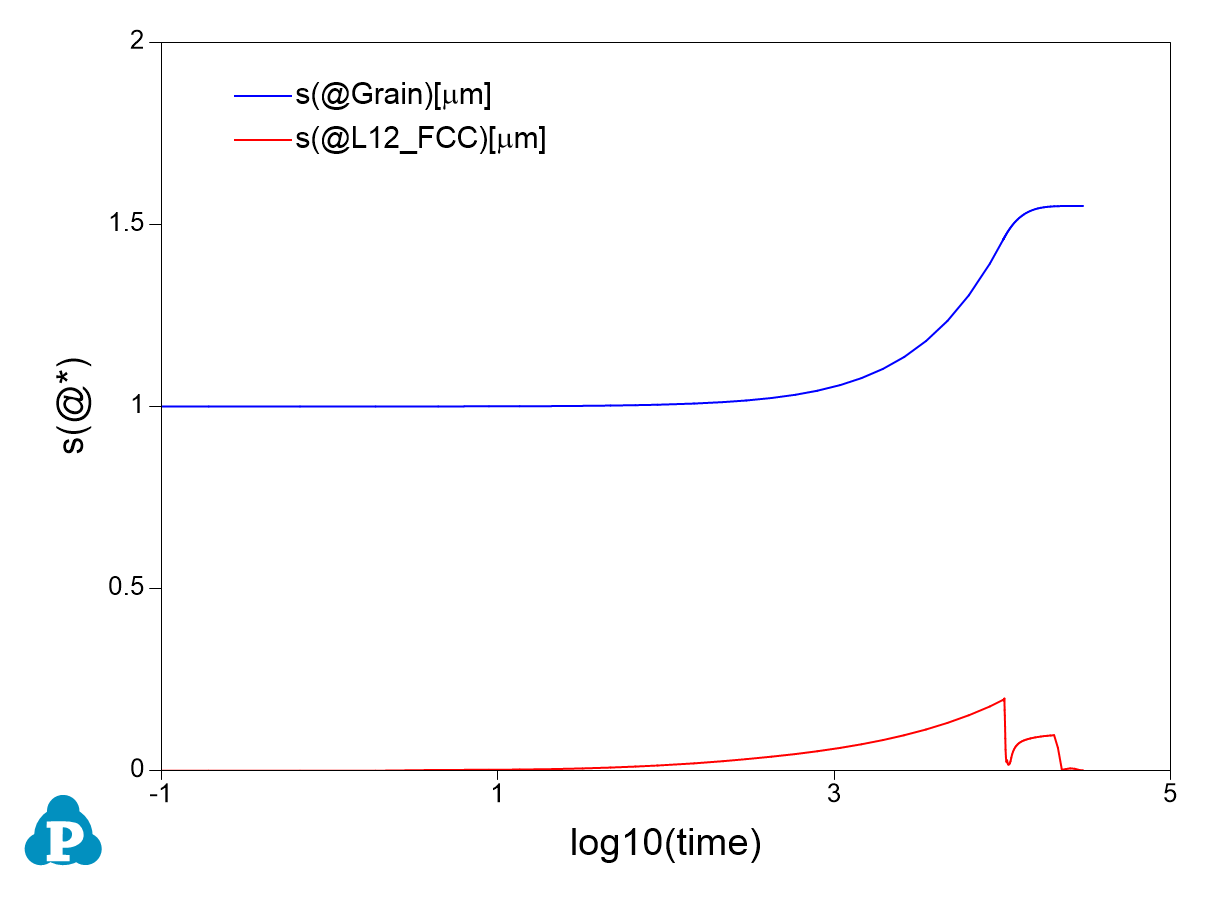
Step 5: Customize Simulation Results
The same as all other calculations available in Pandat™, upon the completion of the precipitation simulation, a default table with related kinetic properties (such as time, total transformed volume fraction, average size of each precipitate phase, number density of each precipitate phase and nucleation rate of each precipitate phase) is automatically generated and a default graph for average size changes is displayed in Figure 5.