An Example to Show How to Set an Initial Microstructure for Simulation
Reference Folder: $Pandat_Installation_Folder\Pandat 2022 Examples\PanPrecipitation\Ni-16%Al_Dissolution\Al-Ni.ini
This example is to demonstrate how to set up the initial microstructure for dissolution simulation. In this example, the alloy composition is Ni-16Al at.%, which is isothermally annealed at 1444K for 100 seconds. The alloy composition and heat treatment condition is given in Ni-16Al_dissolution.pbfx. Initially, there is 10% (volume fraction) L12_Fcc (γ’) phase with average particle size 1.2µm. The initial microstructure is set in Al-Ni.ini as shown below:
<Condition name="C1">
<MatrixPhase name="Fcc">
<PrecipitatePhase name="L12_FCC">
<Parameter name="size" value="1.2e-6" description="average size" />
<Parameter name="volume_fraction" value="0.1" description= "volume fraction" />
<Parameter name="particle_size_distribution" value="2" number_cells =
"200" sigma="0.25" description="initial psd shape: 0-uniform; 1-normal; 2-lognormal;10: user-defined psd" />
<psd>
<cell size="1.2E-08" number_density="170191212760.267" />
<cell size="2.4E-08" number_density="199242482086.767" />
<cell size="3.6E-08" number_density="232879833831.677" />
<cell size="4.8E-08" number_density="271760886495.754" />
<cell size="6E-08" number_density="316626417716.63" />
……
</psd>
</PrecipitatePhase >
</MatrixPhase >
</Condition>
The “<psd> ” section can be empty if uniform, normal or lognormal distribution is selected and the initial PSD is automatically generated based on the defined number_cells and standard deviation sigma. If the “<psd> ” section is given, the provided psd data will be used and the defined initial psd shape (uniform, normal or lognormal distribution) is neglected.
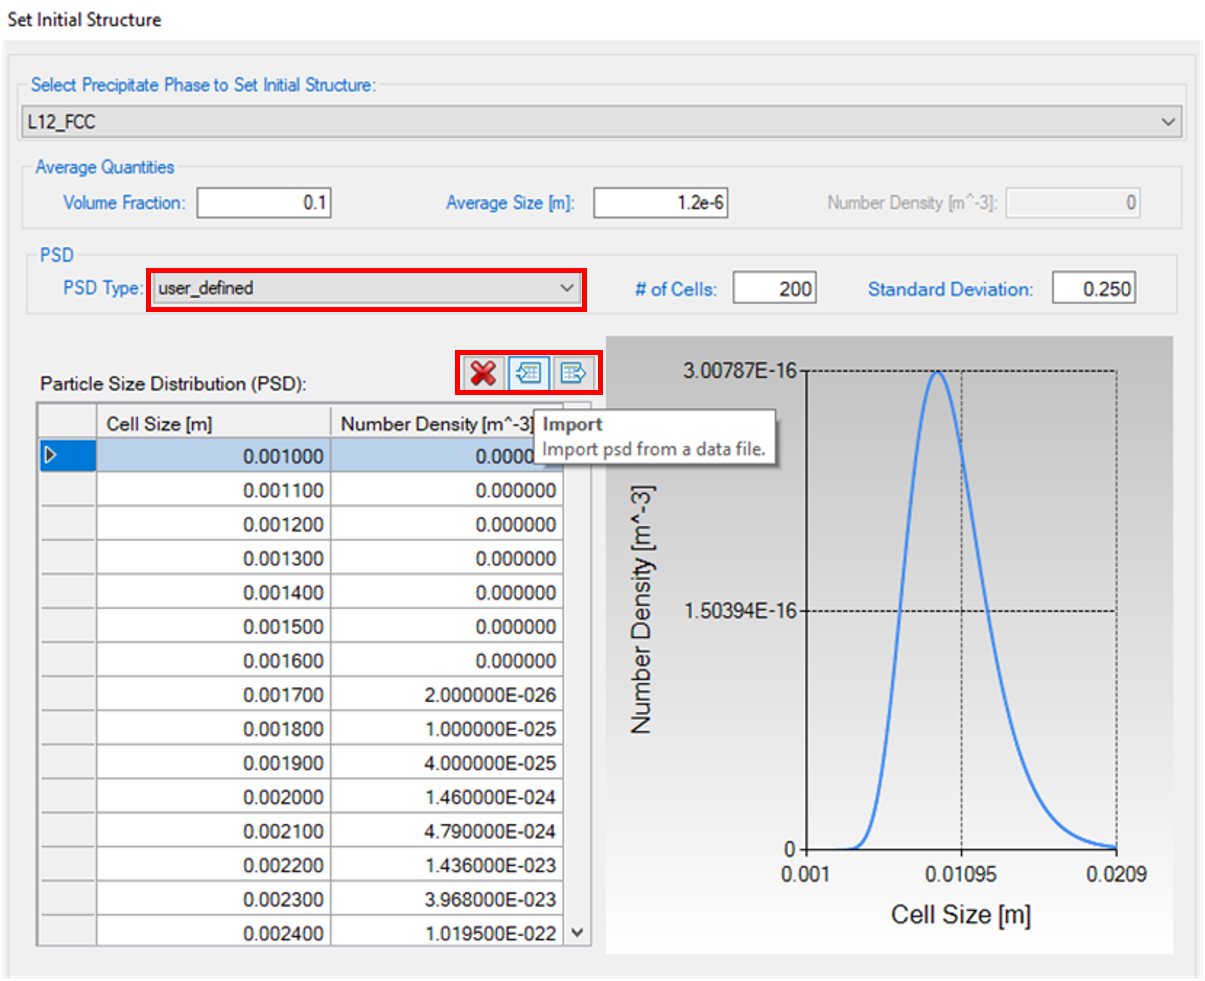
User can also define the initial structure from GUI. User first chooses the target phase to set the initial structure and then set the average quantities including the volume fraction and average size. The PSD type can be “uniform”, “normal”, “log_normal” or “user_defined”. When “normal” and “log_normal” are selected, the PSD data will be generated and the corresponding plot is shown on the right panel. In order to load a user defined PSD, the user can set PSD type to be “user_defined” and then load the PSD data file by clicking the import button. An example PSD data file “psd_test.dat” can be found in the folder: $Pandat_Installation_Folder\Pandat 2021 Examples\PanPrecipitation\Ni-16%Al_Dissolution\.