Numerical Model
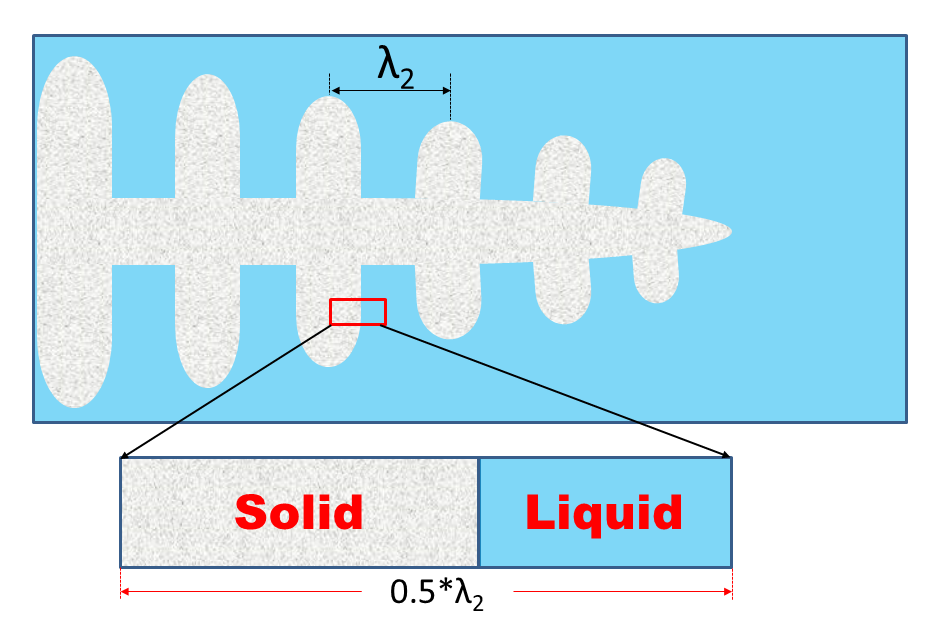
The PanSolidification module, developed by coupling a solidification micro-model with a modified Scheil approach, incorporates back-diffusion, undercooling, and dendrite arm coarsening. Figure 1 depicts a dendrite with a primary trunk and symmetrically distributed secondary arms, where the secondary dendrite arm spacing (SDAS) is denoted as λ2. Solidification is typically modeled using a one-dimensional morphology within the interdendritic region (enlarged in the lower part of Figure 1). Due to the symmetry of the dendrite arms, mass flow through the arm center is negligible, allowing only half of the arm spacing to be considered.
Back Diffusion in the Solid
The evolution of the concentration profile for component i in the considered dendrite arm is shown schematically in Figure 2.
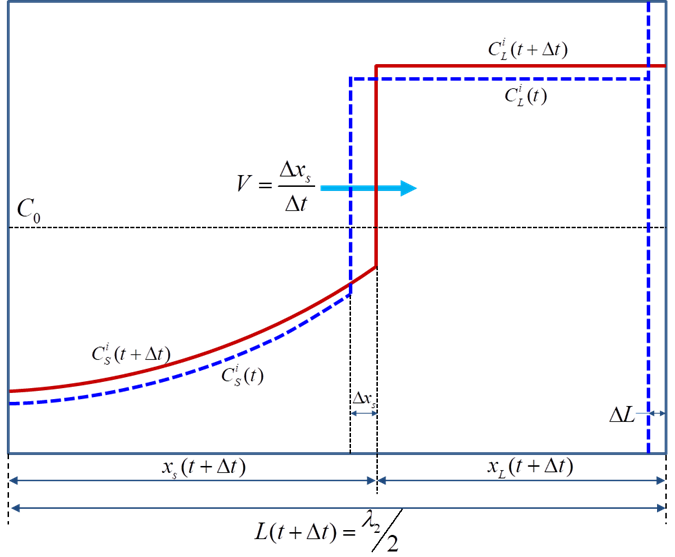
Figure 2: A schematic plot showing the composition distribution of component i in a dendrite arm at time t and t+Δt
 and
and  are compositions of component i within the liquid and solid phases (given the unit of wt.% in this work), respectively. V is the velocity of S/L interface. During the time interval Δt, the S/L interface advances Δxs (due to solidification) and the length of the solidification region increases by ΔL (due to the SDAS coarsening). For the current solidification simulation at each time step, three major tasks are carried out: (1) calculate the composition of each component at the S/L interface including the undercooling effects and local-equilibrium conditions; (2) solve the diffusion equations within the solid phase; (3) update the length scale to conserve mass balance for every component. More detailed description on the back diffusion can be found in some textbooks [1974Fle, 1985Kur].
Micro-Model for Dendrite Arm Coarsening
The initial SDAS is about twice of the dendrite tip radius:  and
and  is described as a function of initial alloy composition, growth rate, and independent of temperature gradient:

|
where V, ΔT0, ke are the interface solidification velocity, freezing temperature range, and equilibrium partition coefficient, respectively. δ is a constant being dependent on the harmonic of the perturbation.
The dendrite arm spacing needs to be known since it sets the diffusion distances in the liquid and solid phases. Owing to the re-melting and re-solidification mechanism, dendrite arm coarsening contributes significantly to homogenization during solidification. The calculation of coarsening is described as below [1986Roo]:

|
(2) |
 is the initial SDAS obtained from the calculated dendrite tip radius as described in above Eq. 1, and
  is the model predicted SDAS at a certain time. M is coarsening parameter which is proportional to
 , t is time and g is the geometry factor representing the influence of the dendrite geometry.
For a binary system, the coarsening parameter M is defined as [1990Roo]:

|
For a multi-component system, the coarsening parameter must be calculated separately for each alloying element. Then, the following model is used to take into consideration all the solute elements:

|
(4) |
All phase equilibrium related quantities needed in the above equations (such as mL and ke) are directly calculated via PanEngine [2009Cao] at each time step by assuming the local equilibrium at the liquid/solid interface.
Solute Trapping Effect
One of the key assumptions of the Scheil solidification model is that the solid-liquid interface remains in equilibrium. However, under rapid solidification conditions—such as those encountered in additive manufacturing—the interface deviates from the equilibrium tie-line due to the finite diffusivity of solutes in the liquid phase. When the diffusional velocity of solutes,  , becomes comparable to the solid-liquid interface velocity,
  , local equilibrium can no longer be maintained, resulting in the solutes being effectively trapped within the solid phase. This phenomenon is known as solute trapping [2020Pin].
Under typical additive manufacturing processing conditions ( ranging from 0.1 to 1 m/s and cooling rates of 103 – 106 K/s), partial solute trapping occurs, leading to an increase in the partition coefficient (
 ) from its equilibrium value (
 ), while still remaining below 1 (
 ). Complete solute trapping (
 ) is only observed at significantly higher interface velocities (
 m/s).
m/s).
In PanSolidification, we employ the Ludwig model [1998Lud] to describe partial solute trapping. This model, directly coupled with our CALPHAD databases, predicts solute trapping using chemical rate theory. It accounts for atomic exchanges among all possible solutes (i.e., solute redistribution, as illustrated in Figure 3) and enables the simulation of solute trapping in arbitrary multi-component alloys.
The interface velocity,  , in the Ludwig model is related to the chemical driving force,
  (red arrow in Figure 4), through the following expression:

|
(5) |
where  is the maximum possible crystal growth velocity, typically of the order of speed of sound ~1000 m/s;
  is the solute drag parameter (
  ) and
) and  is the free energy dissipated in solute-drag. For typical solidification problems,
  describes the experimental results [2000Kit]. However, in some cases solute drag effects (
 ) must be considered to explain the experimental results [2024Hari].
Key Assumptions in the Ludwig Model
-
The Ludwig model is applied only to the selected primary phase and the liquid phase, while all other phases follow standard equilibrium calculations.
-
The primary phase must exhibit solubility for all solutes, and the liquid phase diffusivity for all solutes must be available from the database.
-
The liquidus temperature of the two phase system (Liquid + Primary phase) is a function of the interface velocity
 .
.
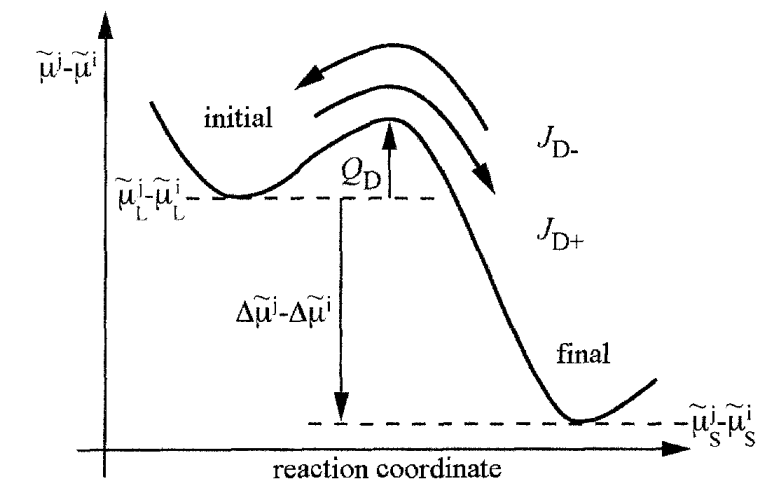
 . Initial state:
  in the liquid and
  in the solid. Final state:
  in the solid and
  in the liquid. [1998Lud]
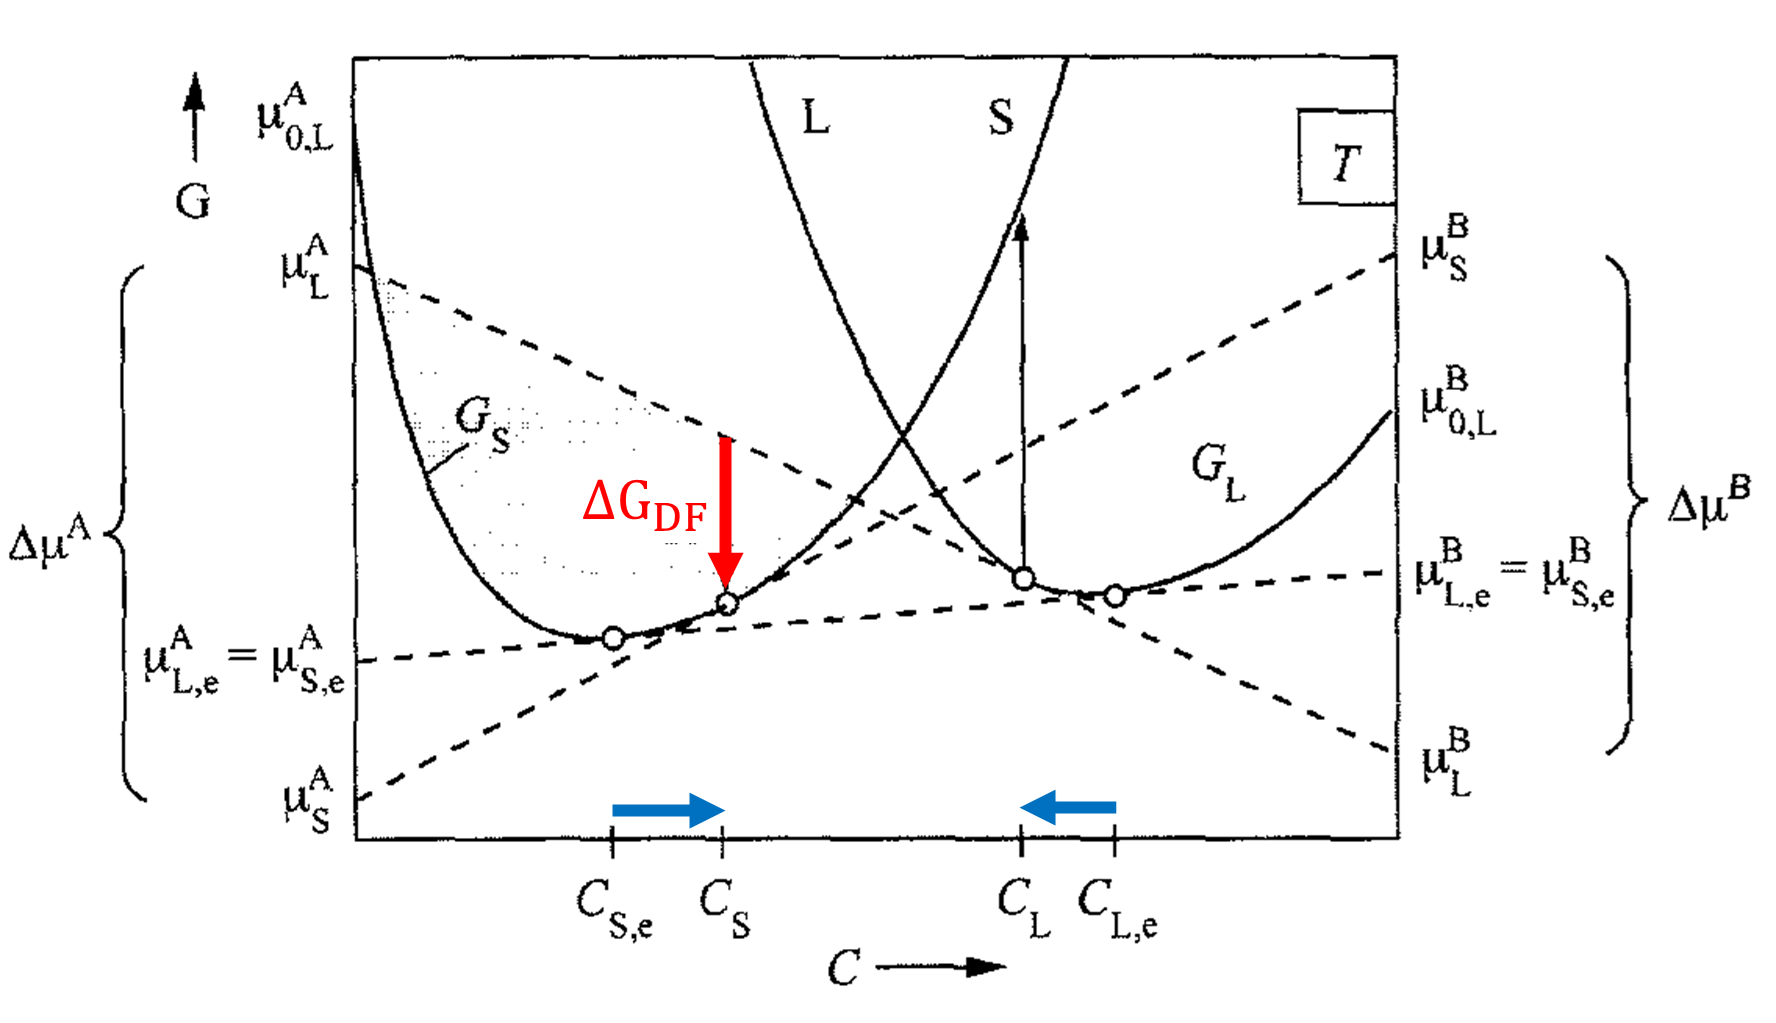
 (red arrow) that arises due to the deviation (blue arrow) from the equilibrium concentration. [1998Lud]
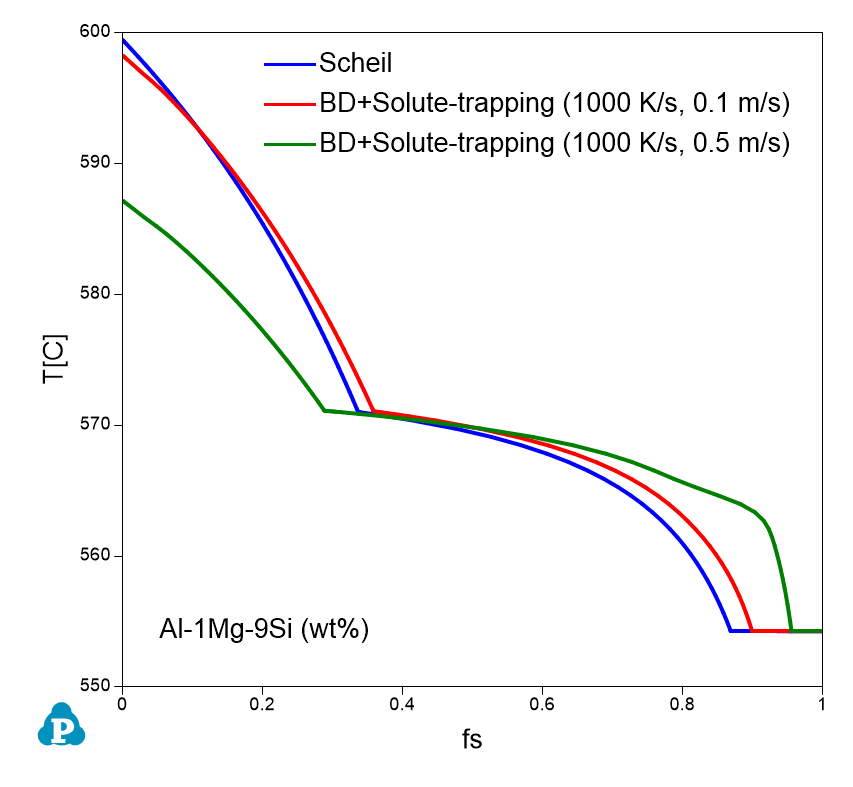
Users can refer to the batchfile in Pandat Examples folder (PanSolidification/Al_alloy/AlSiMg_solutetrapping_v0.1ms.pbfx) for enabling solute trapping in the calculations. Figure 5 illustrates the effect of solute trapping on the solidification curve of the Al-1Mg-9Si wt.% alloy under different solidification rates. The liquidus temperature of the alloy decreases with increase in velocity as shown in the Figure 5. Furthermore, the volume fraction of the eutectic phase also decreases with increase in solidification velocity.
references:
[1974Fle] M.C. Flemings, Solidification Processing, McGraw-Hill, 1974.
[1985Kur] W. Kurz and D.J. Fisher, Fundamentals of Solidification, Trans Tech Publications, Switzerland, 1985.
[1986Roo] A. Roósz, E. Halder, and H.E. Exner. “Numerical calculation of microsegregation in coarsened dendritic microstructures”, Mater. Sci. & Tech. 2 (1986): 1149–1155.
[1990Roo] A. Roósz, H.E. Exner, “Numerical modelling of dendritic solidification in aluminium-rich Al-Cu-Mg alloys”, Acta Metall. Mater., 38 (1990): 375-380.
[1998Lud] Ludwig, A. The interface response-functions in multi-componental alloy solidification. Physica D: Nonlinear Phenomena, 124 (1998): 271-284.
[2000Kit] J.A. Kittl, P.G. Sanders, M.J. Aziz, D.P. Brunco, M.O. Thompson, Complete experimental test of kinetic models for rapid alloy solidification, Acta Mater. 48 (2000): 4797–4811.
[2009Cao] W.S. Cao et al., “PANDAT software with PanEngine, PanOptimizer and PanPrecipitation for multi-component phase diagram calculation and materials property simulation”, Calphad, 33 (2009): 328-342.
[2020Pin] Pinomaa, T., Laukkanen, A., & Provatas, N. Solute trapping in rapid solidification. MRS Bulletin, 45 (2020): 910-915.
[2024Har] V.S. Hariharan, B.S. Murty, G. Phanikumar, Interface Response Functions for multicomponent alloy solidification—An application to additive manufacturing, Comput. Mater. Sci., 231 (2024): 112565.