Calculation of T0 Curve Using User-defined Property
T0 curve is the trace of a series of points in a two-phase field at which the Gibbs energy of the two phases are identical. In this example, the original database is ABC.tdb, and the T0-curve property is defined in the Appended database ABC_T0.tdb. In the ABC_T0.tdb file, the T0-curves of Bcc/Liquid and Fcc/Liquid phases are defined as:
Property GFcc_GLiq 298.15 G(@Fcc)-G(@Liquid); 6000 N !
Property GBcc_GLiq 298.15 G(@Bcc)-G(@Liquid); 6000 N !
Where “Property” is the key word for user-defined property and G(@Bcc), G(@Fcc), G(Liquid) are the Gibbs free energies of the Bcc, Fcc, and Liquid phases, respectively. Note that, the Bcc, Fcc and Liquid are defined in the ABC.tdb. In this particular case, the above “Property” can be directly defined in the ABC.tdb, i.e., the ABC.tdb and ABC_T0.tdb can be combined into one database. This example demonstrates that user-defined property can be separated from the original database. This design makes it possible to obtain user-defined properties even the original database is in encrypted pdb format.
In this example, the GBcc_GLiq property is defined as the Gibbs free energy difference between the Bcc phase and the Liquid phase, and GFcc_GLiq property is defined as the Gibbs free energy difference between the Fcc phase and the Liquid phase.
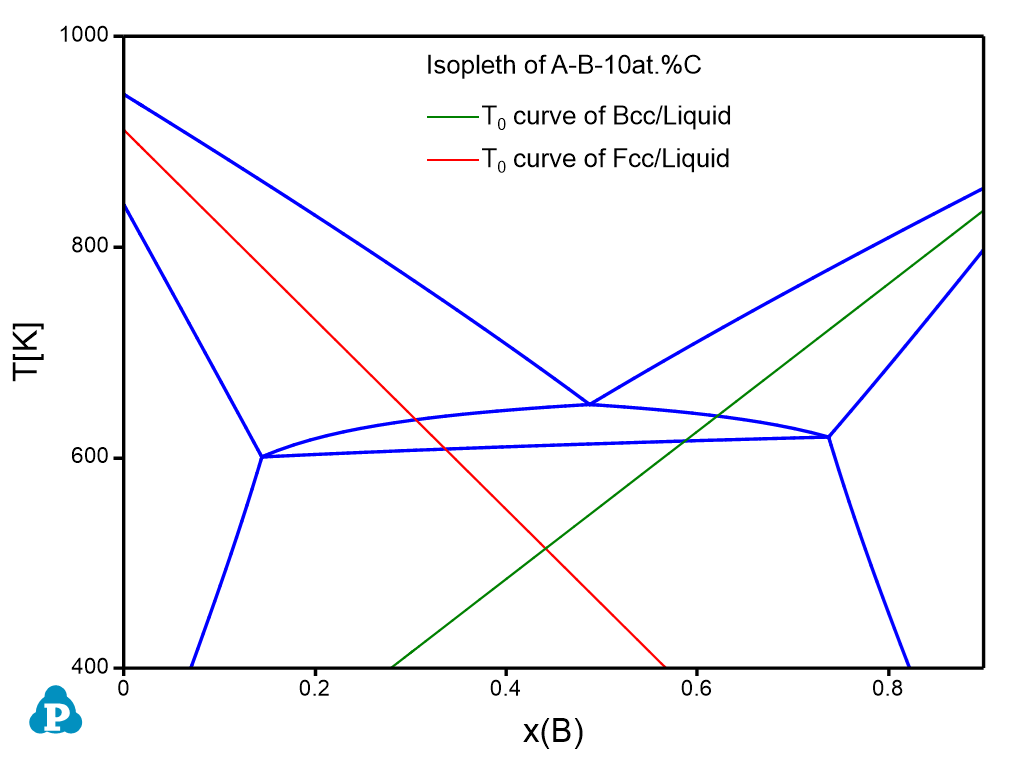
Using the Contour function (Section Contour Diagram), we can calculate contour maps of these user-defined properties and plot them on the calculated phase diagram. When we set the calculation condition as GBcc_GLiq=0, the T0 curve for Bcc/Liquid is obtained as is shown by the green line in Figure 1. Similarly, by setting GFcc_GLiq=0, we obtain the T0 curve for Fcc/Liquid as is shown by the red line in Figure 1.
User can run the ABC_T0.pbfx batch file to obtain Figure 1. Two points should be addressed for this batch file:
-
Both the “start” and “stop” values should set to be zero for the contour mapping as following to get the T0 line.
<contour name="Contour_T0_Fcc_Liq" property="GFcc_GLiq" start ="0" stop ="0" step="1"/>
<contour name="Contour_T0_BCC_Liq" property="GBcc_GLiq" start ="0" stop ="0" step="1"/>
-
To obtain the T0 curve, each phase needs to be considered individually, thus the equilibrium type is set to be “individual”
<individual_phase value="true"/>
<equilibrium_type type="individual"/>
Note: The T0 function has already included in Pandat software as a direct output property since Pandat 2021 version.