Plot 3D diagram in Pandat
In Pandat software, you can not only plot typical 2D phase diagrams (Plot diagrams from table in Table Operation in Pandat), but also some 3D line graphs, surface graphs and color map graphs.
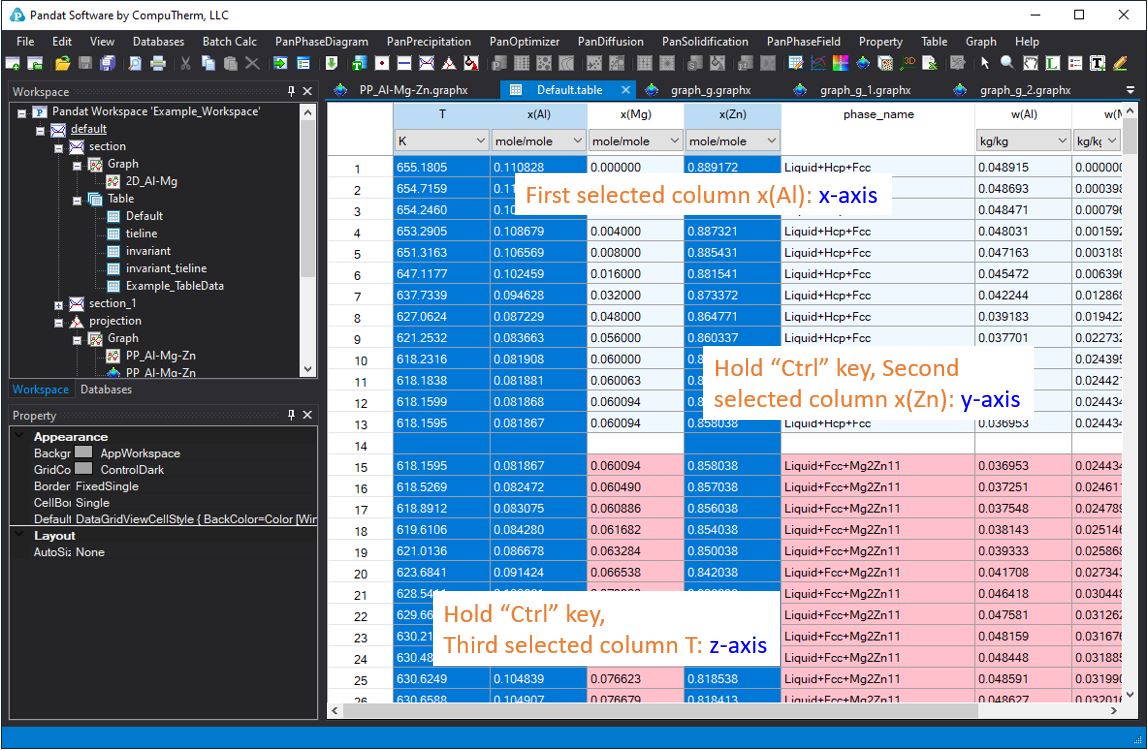
You can plot 3D phase diagram or color map graphs from any table or HTC result report table. The first click select column is set as x-axis, then hold the “Ctrl” key on the keyboard, the second selected column is set as Y-axis, keep holding the “Ctrl” key, the last selected column is the Z-axis in 3D graphs. Please note that the X, Y, Z axis is determined by the sequence of the selection, not related to the position of the columns in the table.
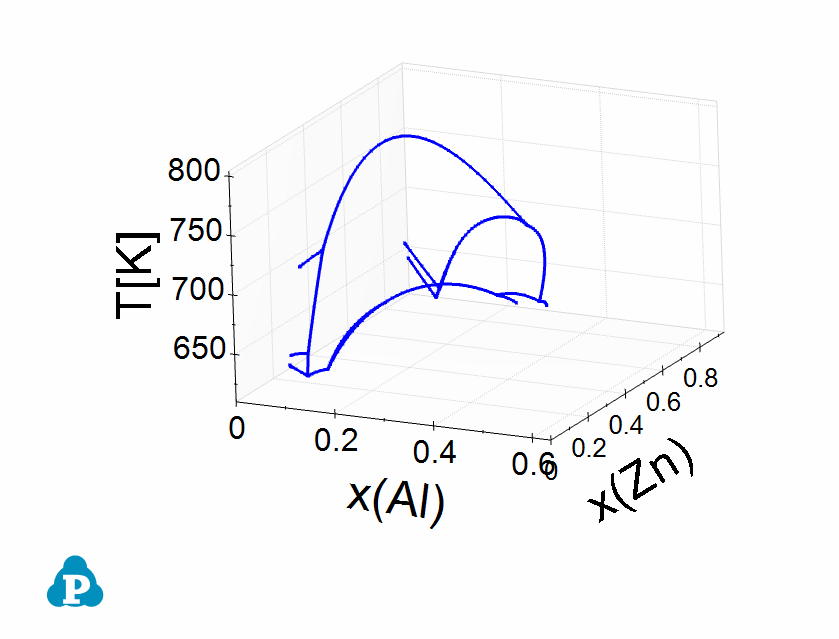
Then, you click the icons from toolbar to plot different types of 3D phase diagram. ![]() icon for 3D line graph;
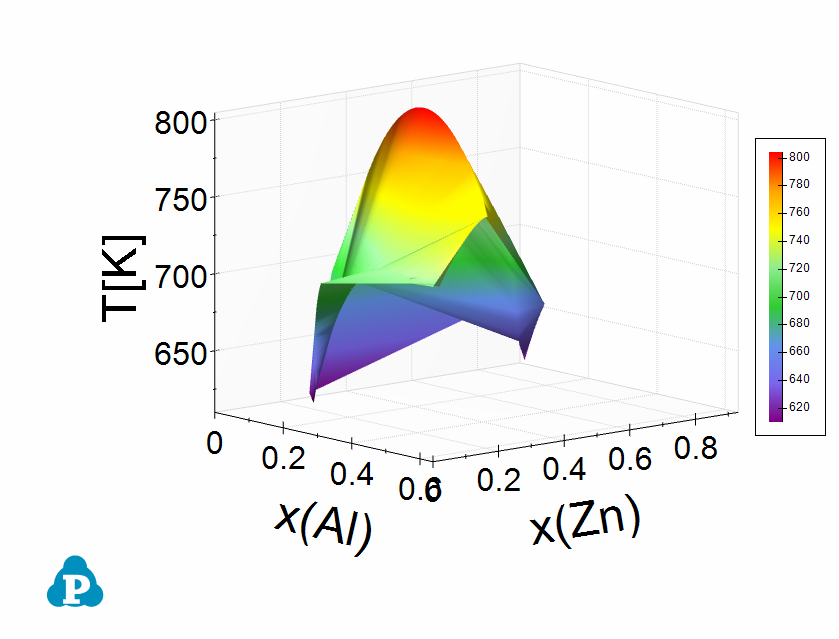
icon for 3D line graph; ![]() icon for 3D surface graph; and
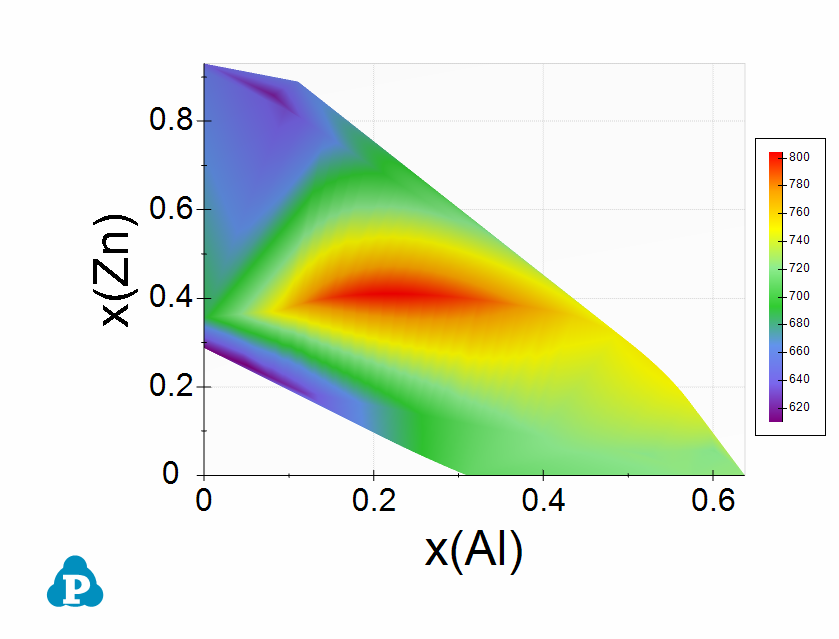
icon for 3D surface graph; and ![]() icon for color map graph. Different types of diagrams are shown as below.
icon for color map graph. Different types of diagrams are shown as below.
|
|
|
|
|
Figure 2: Different types of plotting on the Mg-Al-Zn liquidus temperature |
||