Partial Pressure Contour Diagram
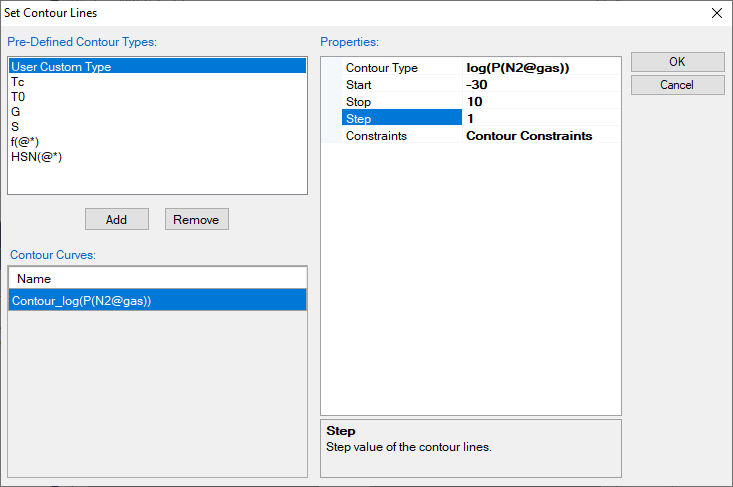
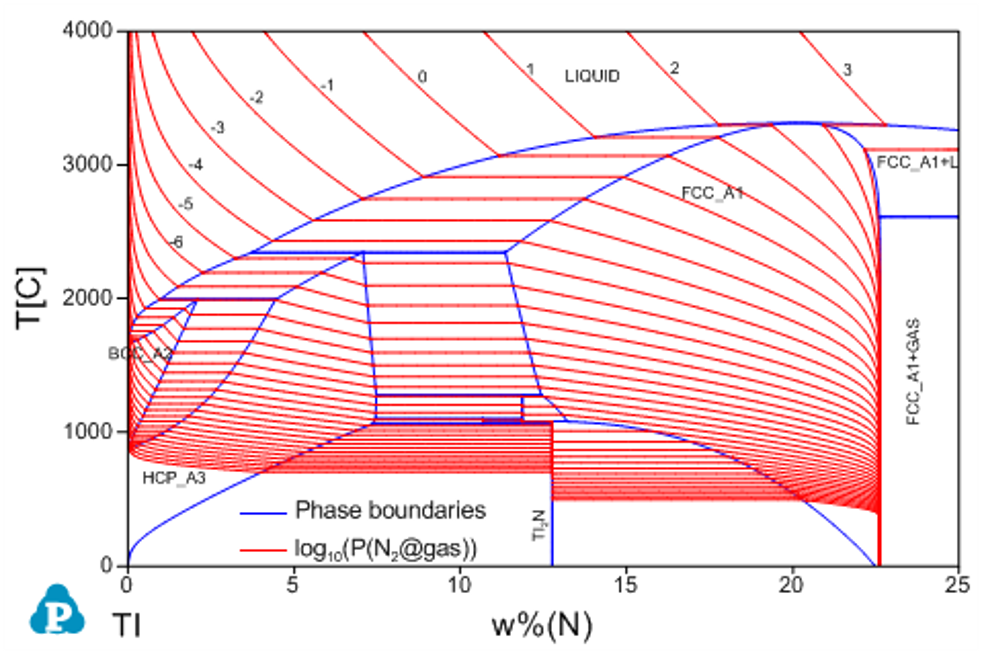
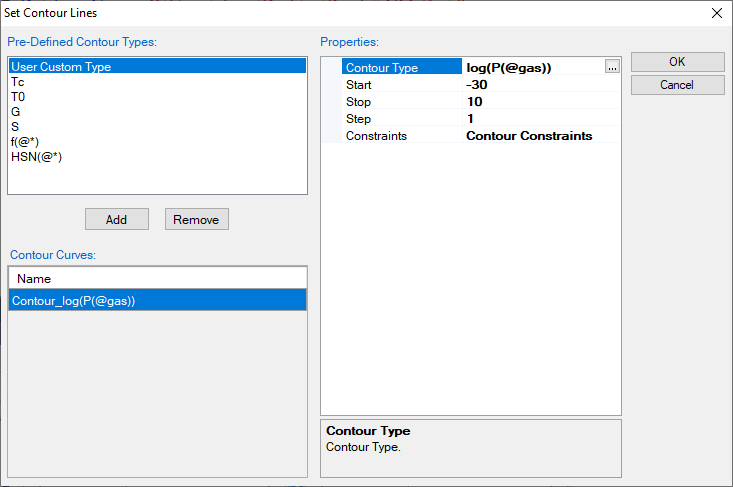
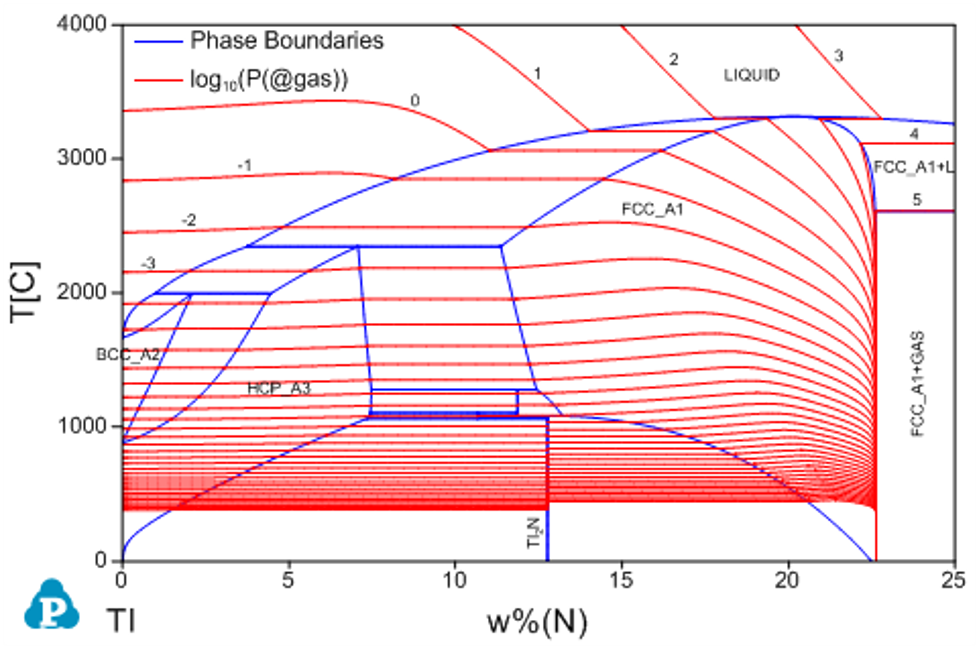
The following example shows how to calculate the contour lines for the partial pressure of the gas phase in the Ti-N system [1996Zen]. Figure 3.59 (a) is the input condition window and Figure 3.59(b) is the calculated phase diagram of Ti-N with the contour lines of log(P(N2@gas)) (pressure unit is Pa), which is the common logarithm of the partial pressure of N2 in gas. Figure 3.59(c) is another input condition window and Figure 3.59(d) is the calculated phase diagram of Ti-N with the contour lines of log(P(@gas)), which is the common logarithm of the total pressure of gas with the gas species N, N2, N3 and Ti.
More examples can be found in the Pandat example folder: /PanPhaseDiagram/Contour/
|
(a) Input condition |
(b) log(P(N2@gas)) contour |
|
(c) Input condition |
(d) log(P(@gas)) contour |
|
Figure 3.59: Contour diagrams of partial pressure of gas in the Ti-N system |
|
[1996Zen] K. Zeng and R. Schmid-Fetzer, “Critical Assessment and Thermodynamic Modeling of the Ti-N System”, Z. Metallkd, 87 (1996): 540-554.