Example 1.32: Calculation of Martensite Start Temperature of an Alloy
Purpose: Learn to calculate the martensite start temperature of an alloy
Module: PanPhaseDiagram
Database: Fe_Demo.rtdb
Batch files: Example_# 1.32a.pbfx (Ms_Lath); Example_#1.32b.pbfx (Ms_Plate)
Currently, the martensite start temperature (Ms) for a single alloy composition can only be calculated through a batch (.pbfx) file, Here we use Example_# 1.32a.pbfx to explain the meaning and syntax in the batch file.
<pbfx version="1.0" encoding="utf-8">
<Header copyright="CompuTherm, LLC">
<!-- this file defines the syntax for a Ms_Lath calculation -->
<Application name="Pandat" version="2026" />
</Header>
<calculation name="Example_# 1.32a" type="point" duration="1.4" original_batch_name="" id="2">
<databases>
<database type="rtdb" file_name="Fe_Demo.rtdb" />
</databases>
<units>
<unit name="P" value="bar" />
<unit name="T" value="K" />
<unit name="n" value="x%" />
</units>
<system name="Default_System">
<components>
<component name="C" status="Selected" />
<component name="Cr" status="Selected" />
<component name="Fe" status="Selected" />
</components>
<phases>
<phase name="*" status="Suspended" />
<phase name="Bcc" status="Entered" />
<phase name="Fcc" status="Entered" />
</phases>
<points>
<point>
<statespace>
<T value="600" />
<P value="1" />
<n component="C" value="0.5" />
<n component="Cr" value="10" />
<n component="Fe" value="" />
</statespace>
</point>
</points>
<condition>
<search>
<phase name="Bcc" status="Fixed" />
<phase name="Fcc" status="Fixed" />
<target property="Ms_Lath" value="0" />
<variable name="T" min="300" max="800" />
</search>
<individual_phase value="true" />
<martensite value="true" />
</condition>
</system>
<output unit="">
<tables>
<table name="Ms_Temperature" source="Default" type="Default">
<column name="T" />
<column name="x(*)" />
<column name="phase_name" />
<column name="f(@*)" />
<column name="Ms_Lath=0" />
<column name="Ms" />
</table>
<table name="MartensiteFraction" source="Default" type="Default">
<column name="T" />
<column name="x(*)" />
<column name="phase_name" />
<column name="f(@*)" />
<column name="Ms_Lath" />
<column name="MFraction" />
<column name="Ms" />
</table>
</tables>
<graphs>
<graph name="graph_g">
<plot table_name="MartensiteFraction" xaxis="T" yaxis="MFraction" />
</graph>
</graphs>
</output>
</calculation>
</pbfx>
The top section of this batch file is similar to the other batch files, defining the system, selected components, unit, compositions, and related settings. The Condition section, which in bold font and seperated by two lines, is unique and deserves special attention. In this section, the phases involved, the Target Property are clearly defined. The searching temperature range is also specified. In addition, the "Individual_phase" must be set as "True".
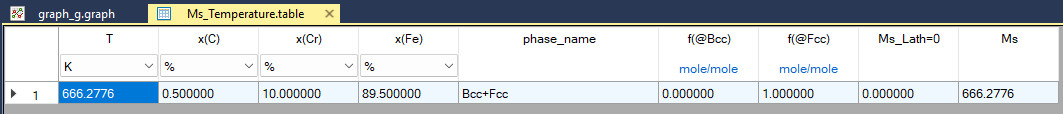
In the bottom section of the batch file, two tables are defined to output the calculation results, one for the Ms temperature and the other for the fraction of martensite as a function of temperature. The martensite transformation temperature can be read from the Ms_Temperature table:
The Graph section also defined the default plot as is shown in Figure 1.32.1.
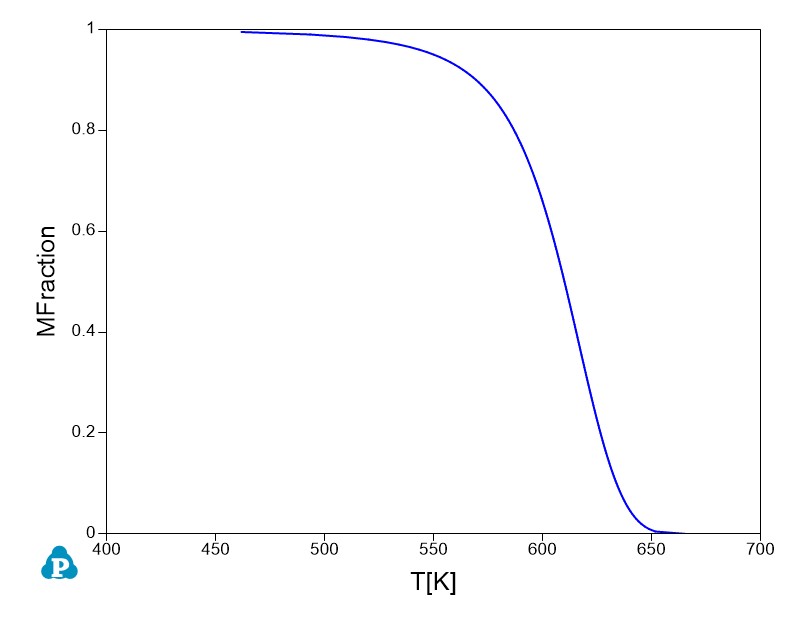
Figure 1.32.1: Calculated martensite fraction vs temperature of Fe-10Cr-0.5C (at.%) alloy