Example 1.12: Calculation of Molar Volume and Density at Fixed Temperature
Purpose: Learn to calculate physical properties in a system
Module: PanPhaseDiagram
Thermodynamic and molar volume Database: Al_Demo.rtdb
Batch file: Example_#1.12.pbfx
Figure 1.12.1 is the Al-Mg binary phase diagram. In this example, we learn to calculate the molar volume and density of the system as a function of x(Mg) at 300°C (the red dash line).
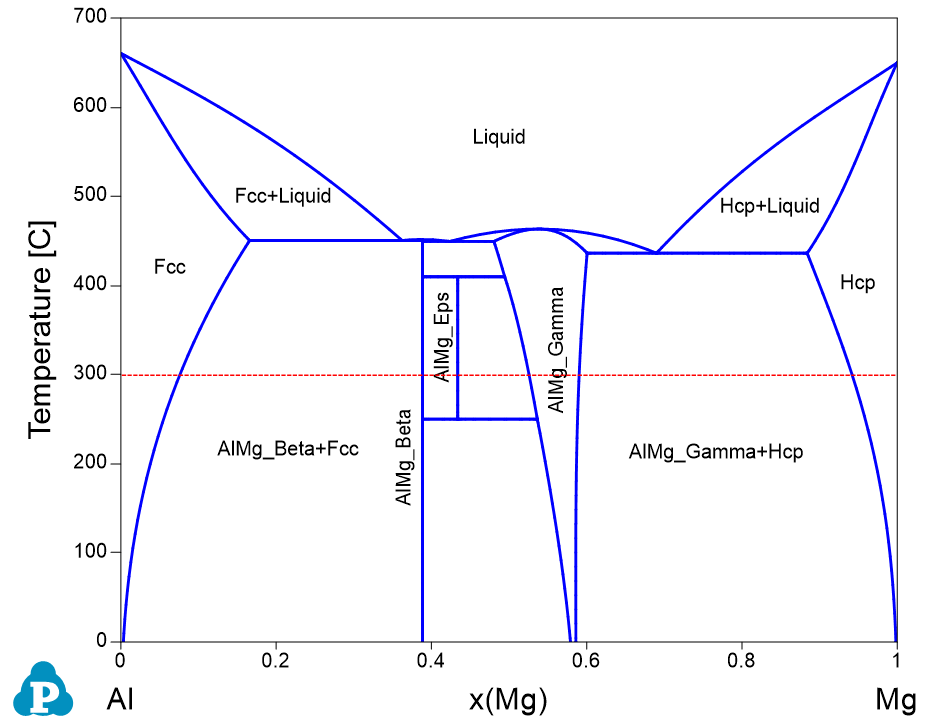
Figure 1.12.1: Al-Mg binary phase diagram
Calculation Method 1, From menu bar “Property”:
- Load Al_Demo.rtdb following the procedure in Pandat User’s Guide: Load Database, and select Al and Mg two components;
- Click “Property” on the menu bar and select “Physical Property”;
- Set Calculation Condition as shown in Figure 1.12.2. The property selected is Vm (molar volume) and density;
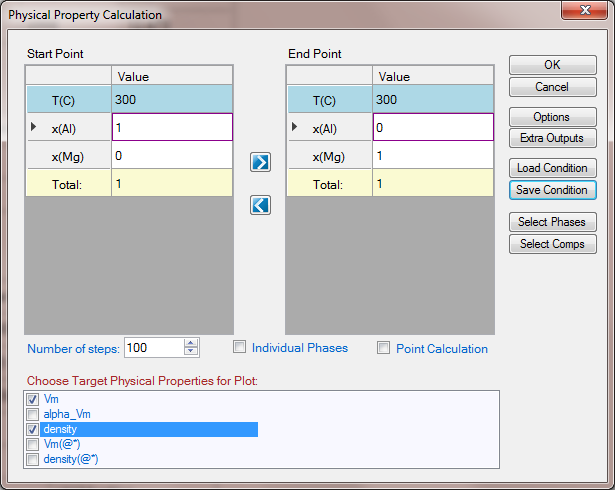
Figure 1.12.2: Setup calculation of molar volume and density from pure Al to pure Mg at 300 °C
Calculation Method 2, From menu bar “PanPhaseDiagram”:
- Load Al_Demo.rtdb following the procedure in Pandat User’s Guide: Load Database, and select Al and Mg two components;
- Click “PanPhaseDiagram” on the menu bar and select “Line Calculation”;
- Add the new table following the procedure in Pandat User’s Guide: Icons for Table on Toolbar, and select Table Type as "Physical_Property"
Information obtained from this calculation:
- Figure 1.12.3 shows the calculated molar volume which increases with the increase of Mg content;
- Figure 1.12.4 is the calculated density which shows the opposite trend as that of the molar volume;
- Details information can be found in the physical_property Table as shown in Figure 1.12.5;
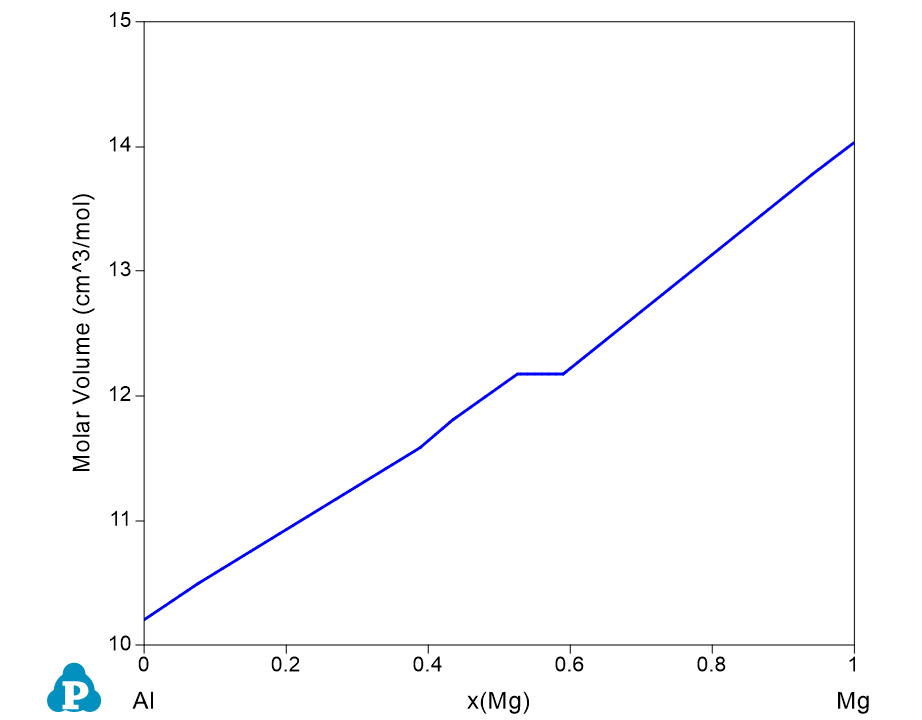
Figure 1.12.3: Calculated molar volume of the system from pure Al to pure Mg in Al-Mg binary at 300 °C
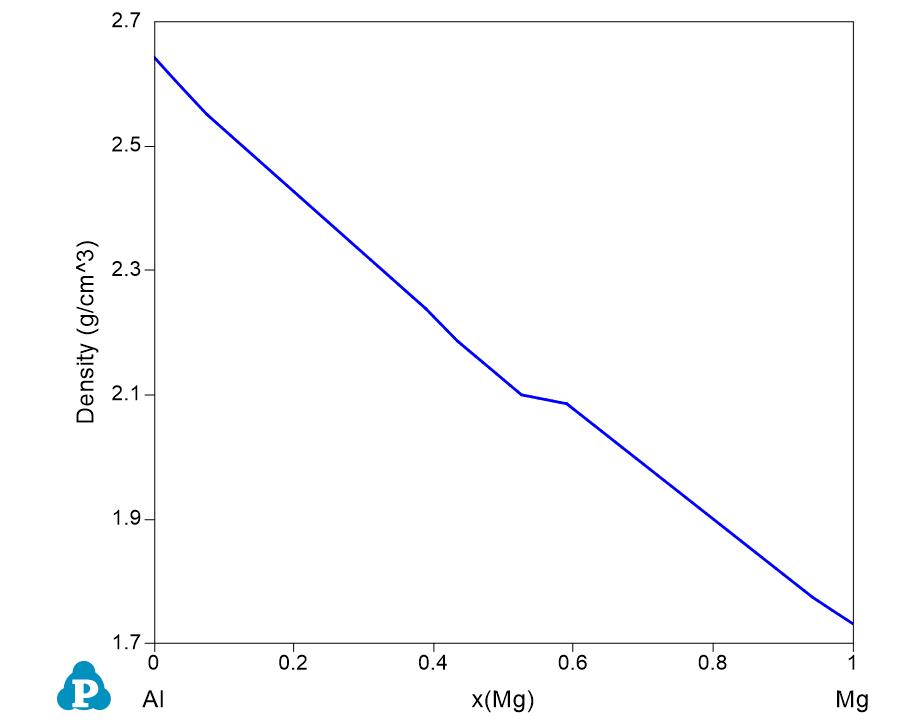
Figure 1.12.4: Calculated density from pure Al to pure Mg in Al-Mg binary at 300 °C
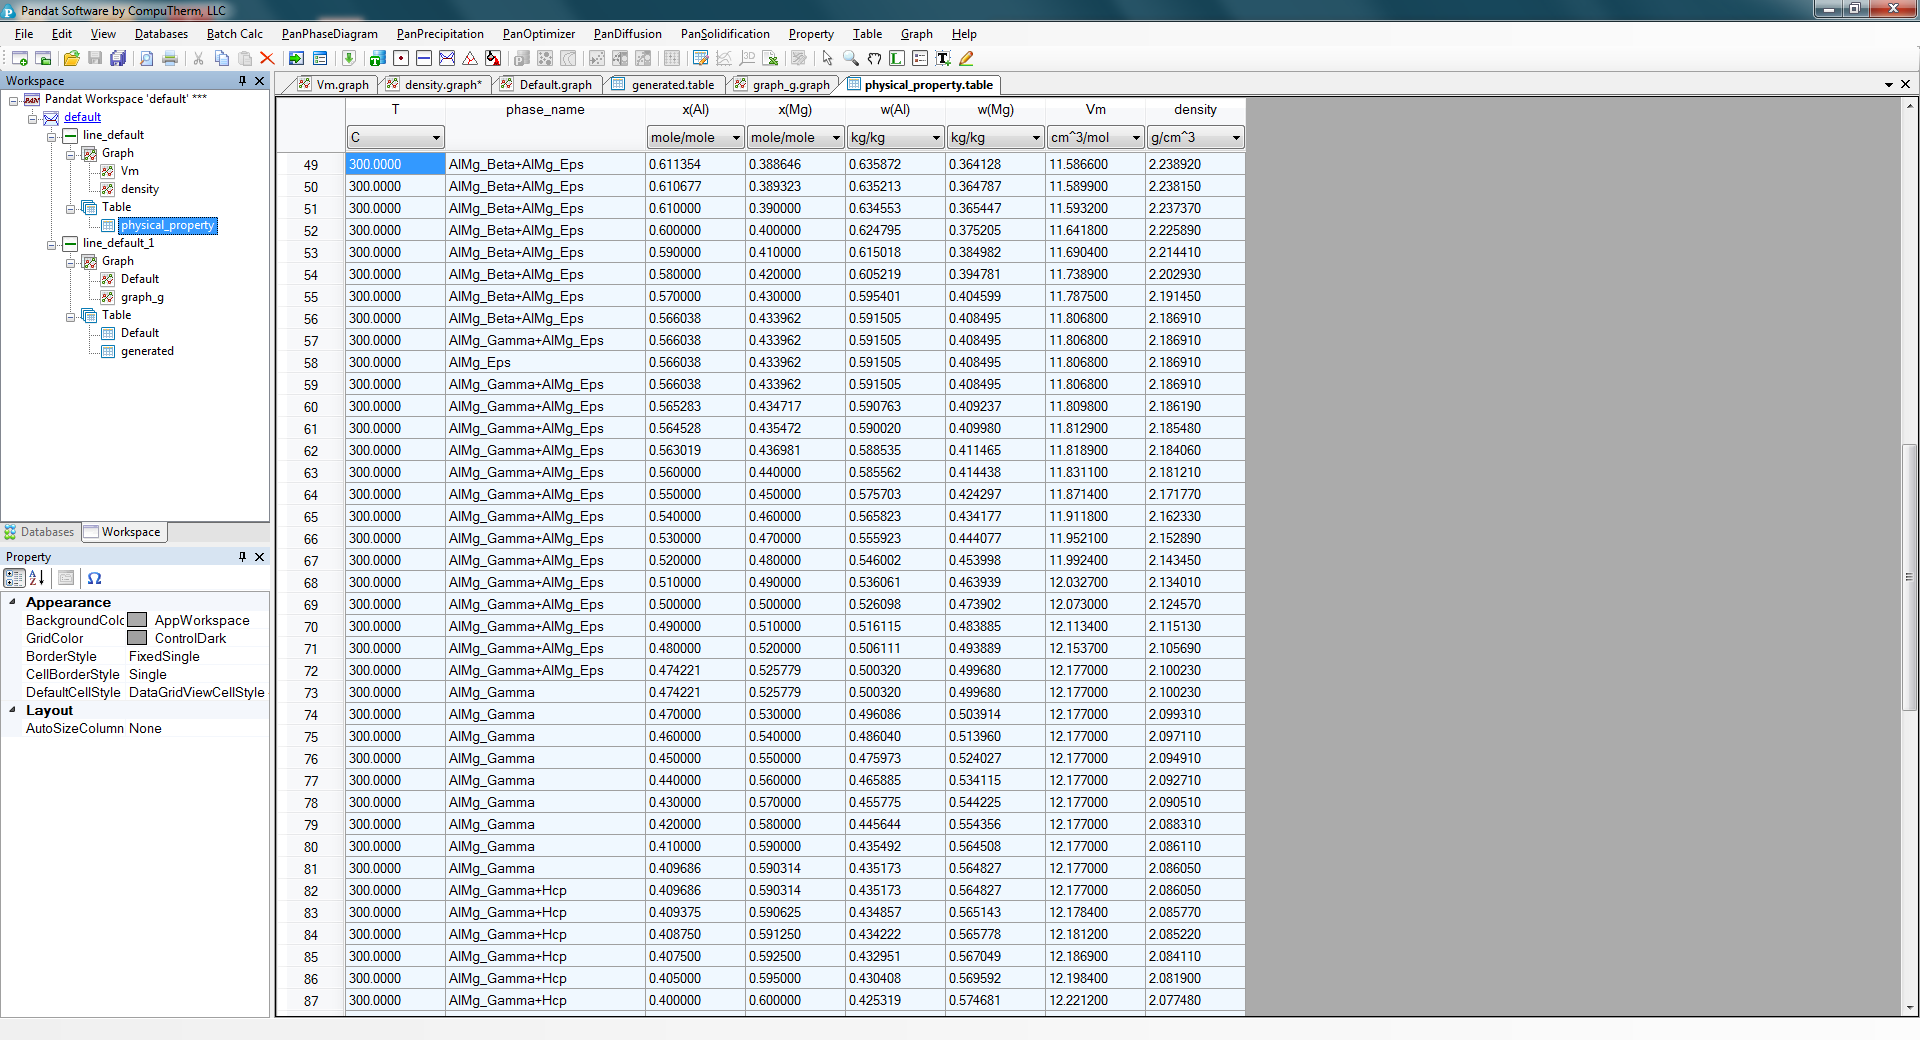
Figure 1.12.5: The physical_property table showing the stable phases varying with the composition and the calculated molar volume and density