Driving Force Contour Diagram
Contour diagram is also useful in viewing the stability of a phase comparing to the equilibrium state. The contour type is defined as DF(@|Hcp) as shown in Figure 3.49 (see Table 11.4 in Section Pandat Table Format Syntax for the definition of DF). Since Hcp phase may not be stable in all the phase regions in this isothermal section, in between “@” and “Hcp” a vertical bar symbol “|” is added to specify that the phase Hcp is in the “entered” status. Figure 3.50 shows the driving force contour lines of the Hcp phase in the Al-Mg-Zn system at 500°C. We see that Hcp phase has less driving force to be stable in the central region of the compositional triangle.
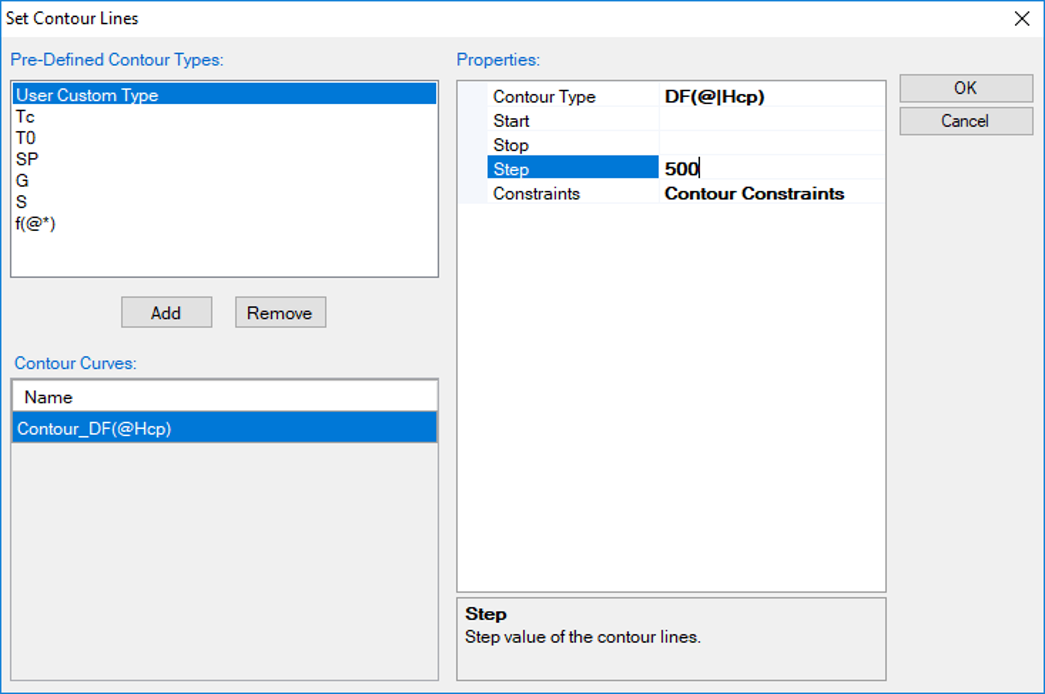
Figure 3.49: Set driving force contour
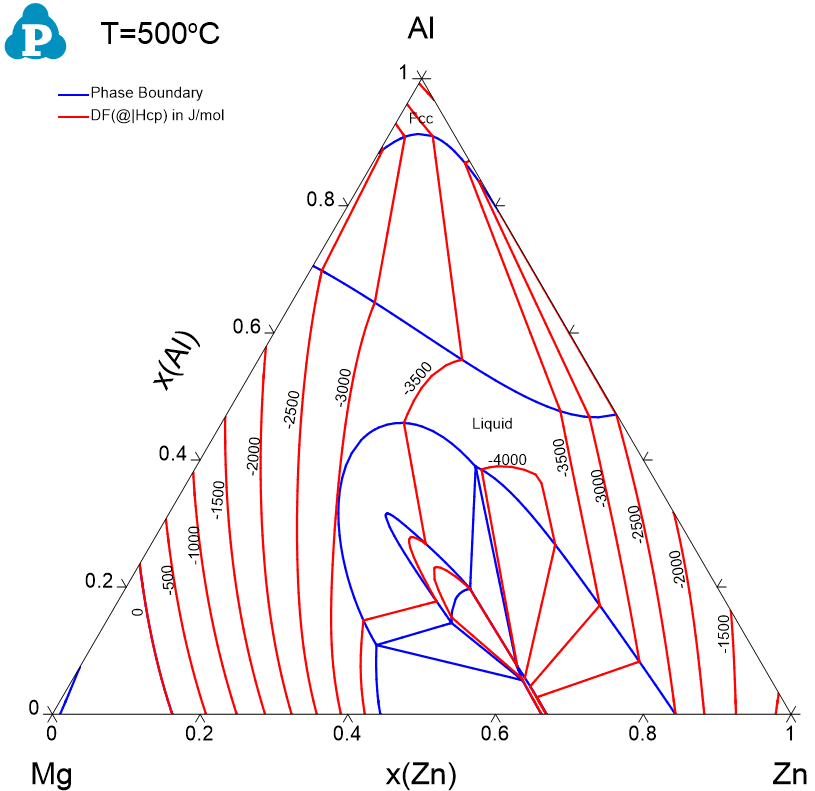
Figure 3.50: Contour diagram of the driving force of the Hcp phase relative to the equilibrium phases in Al-Mg-Zn at 500°C