Partial Molar Property Diagram
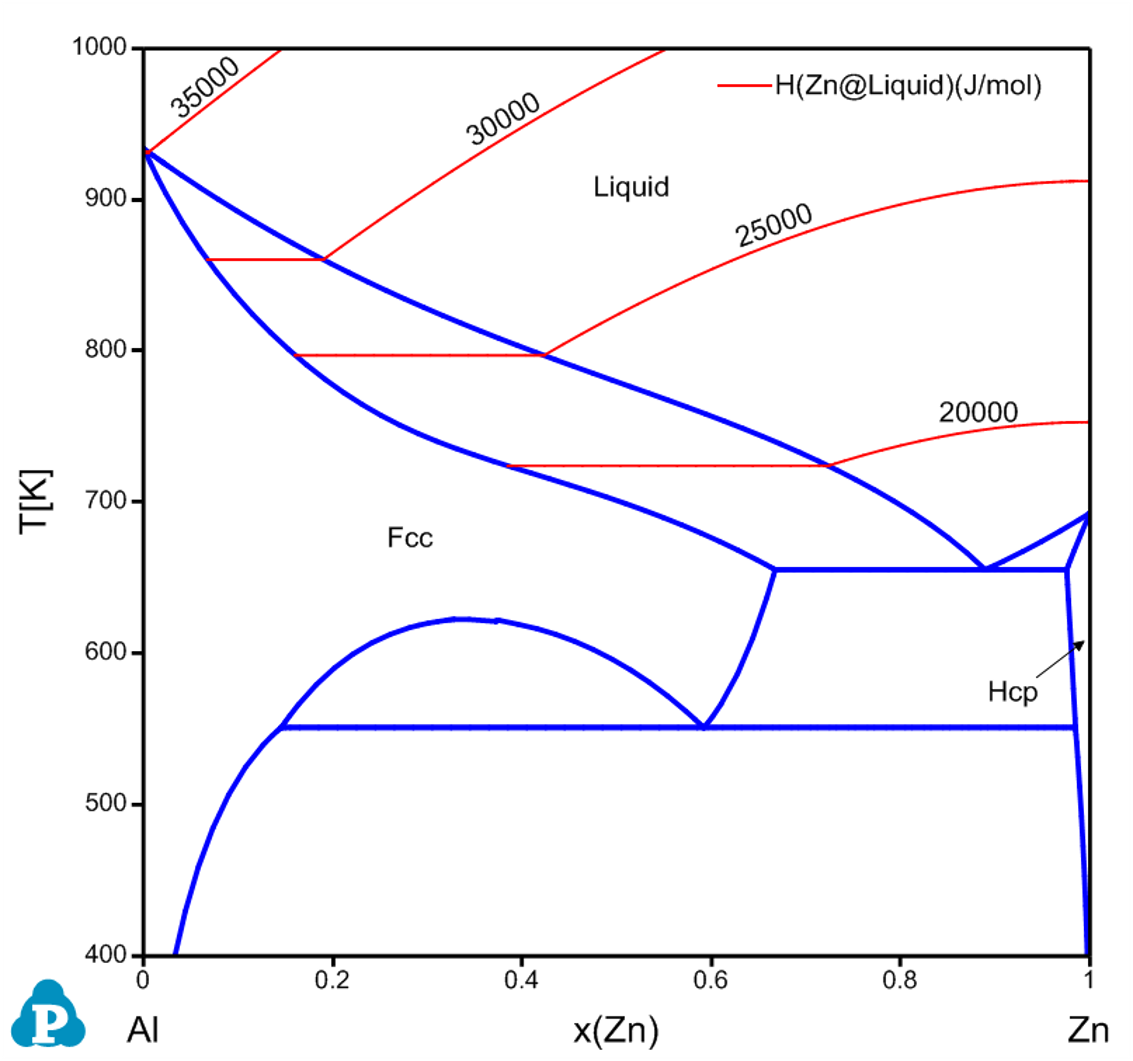
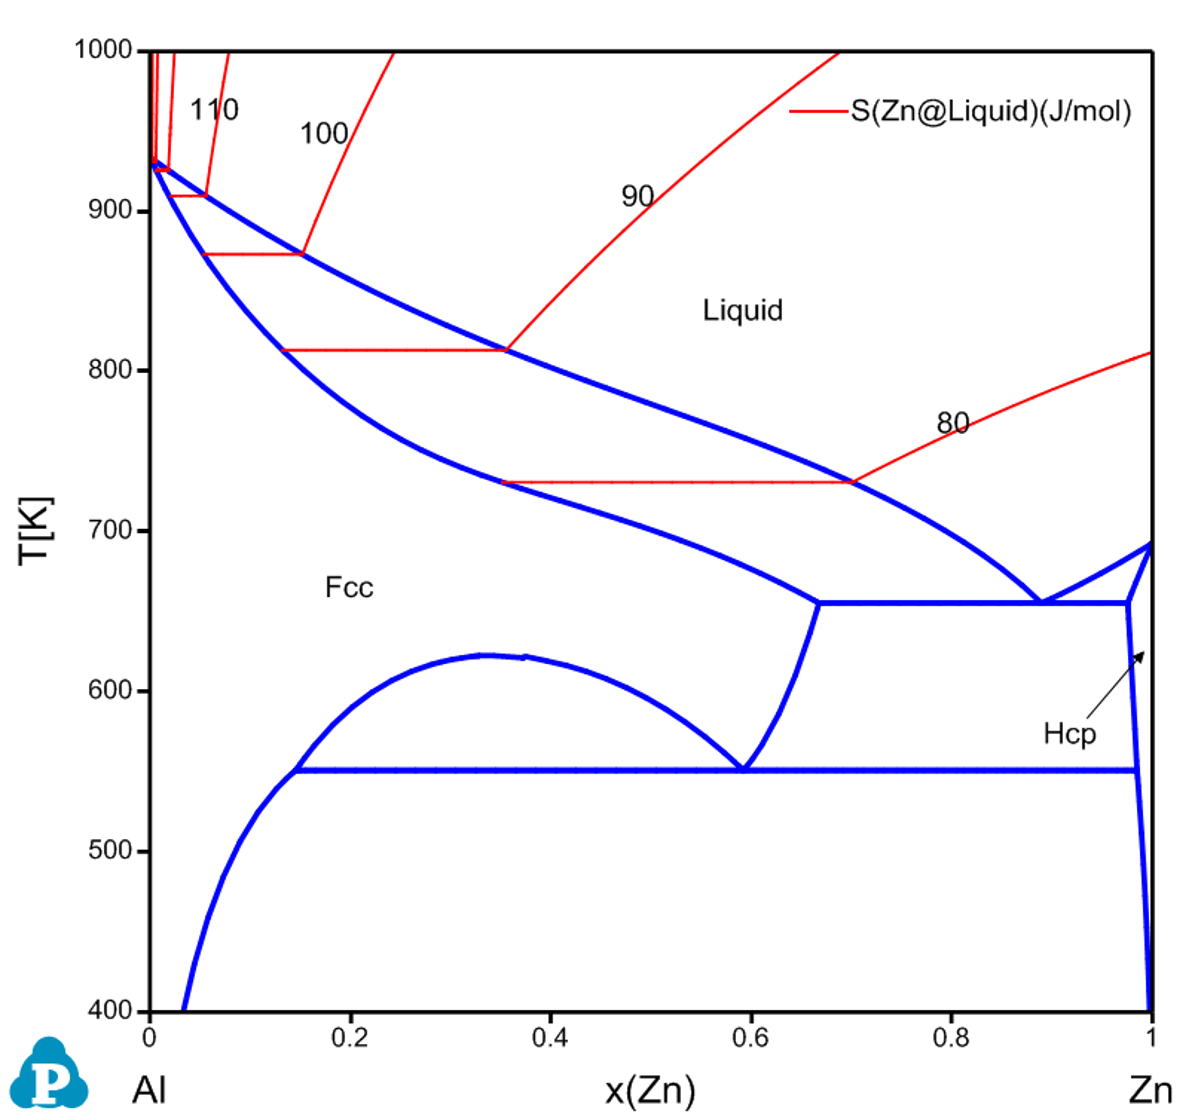
Partial molar properties such as partial molar enthalpy and entropy of a component can also be calculated as a contour diagram along with the phase diagram. The red curves in Figure 3.51 and Figure 3.52 are the calculated contour curves of the partial molar enthalpy and entropy of Zn in the liquid phase for the Al-Zn system. The constraints in both calculations are f(@Liuid)>0 since the calculation is for the stable liquid phase only.