Excess Molar Property Diagram
Sometimes we have interest in the excess properties, such as excess Gibbs free energy, excess enthalpy and excess entropy of a phase. These properties are available from the property definitions of G_ex, H_ex and S_ex in a contour diagram. Figure 3.53, Figure 3.54 and Figure 3.55 show the calculated contour curves for the excess properties of liquid in the Mg-Zn system.
|
Figure 3.53: Contour diagram of the excess Gibbs free energy in the liquid phase of Mg-Zn system |
Figure 3.54: Contour diagram of the excess enthalpy in the liquid phase of Mg-Zn system |
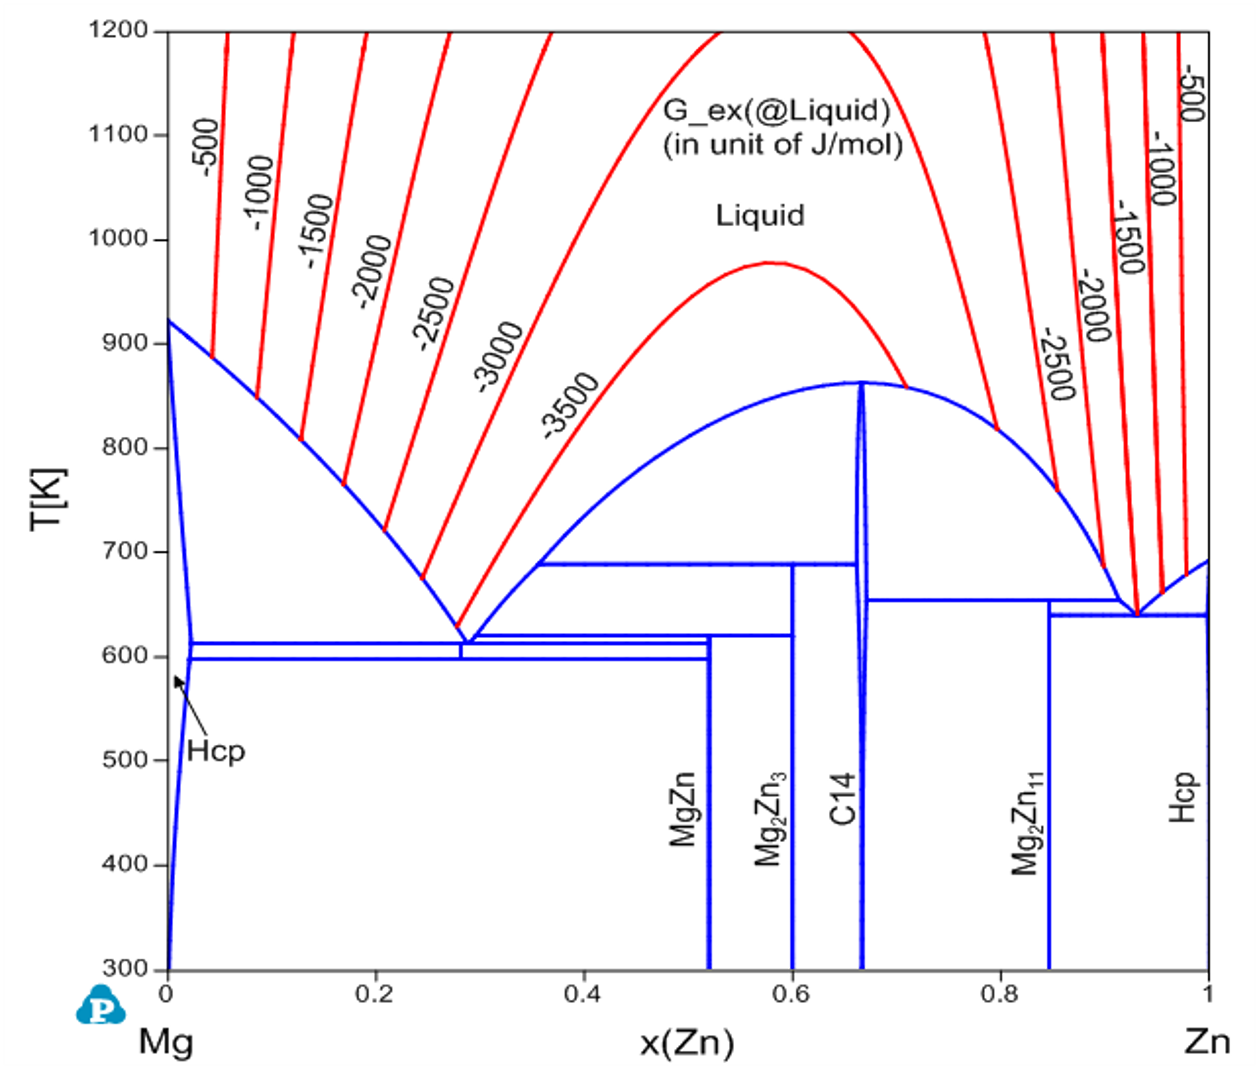
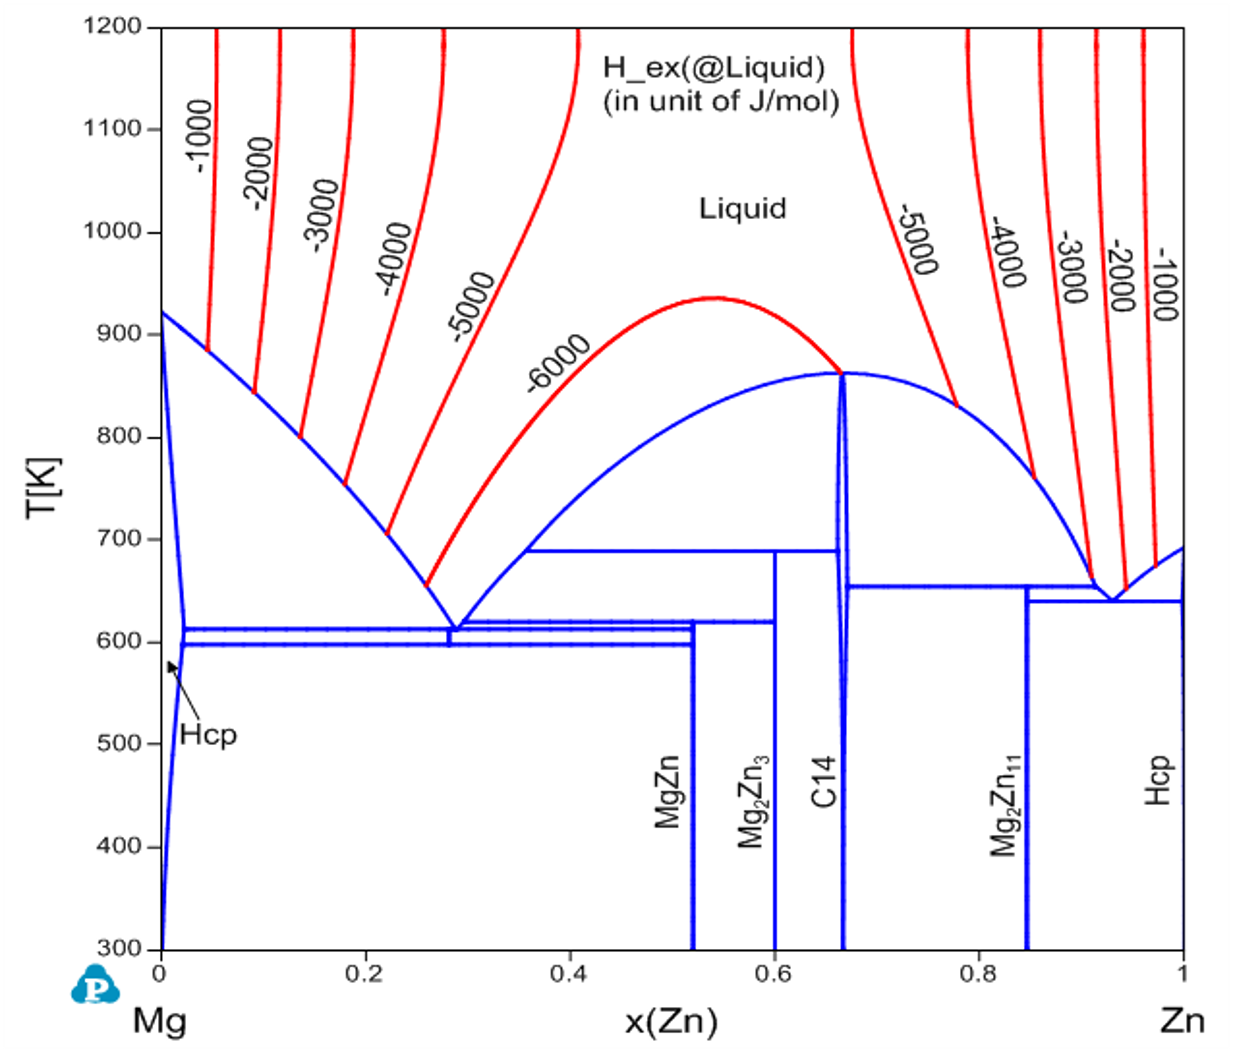
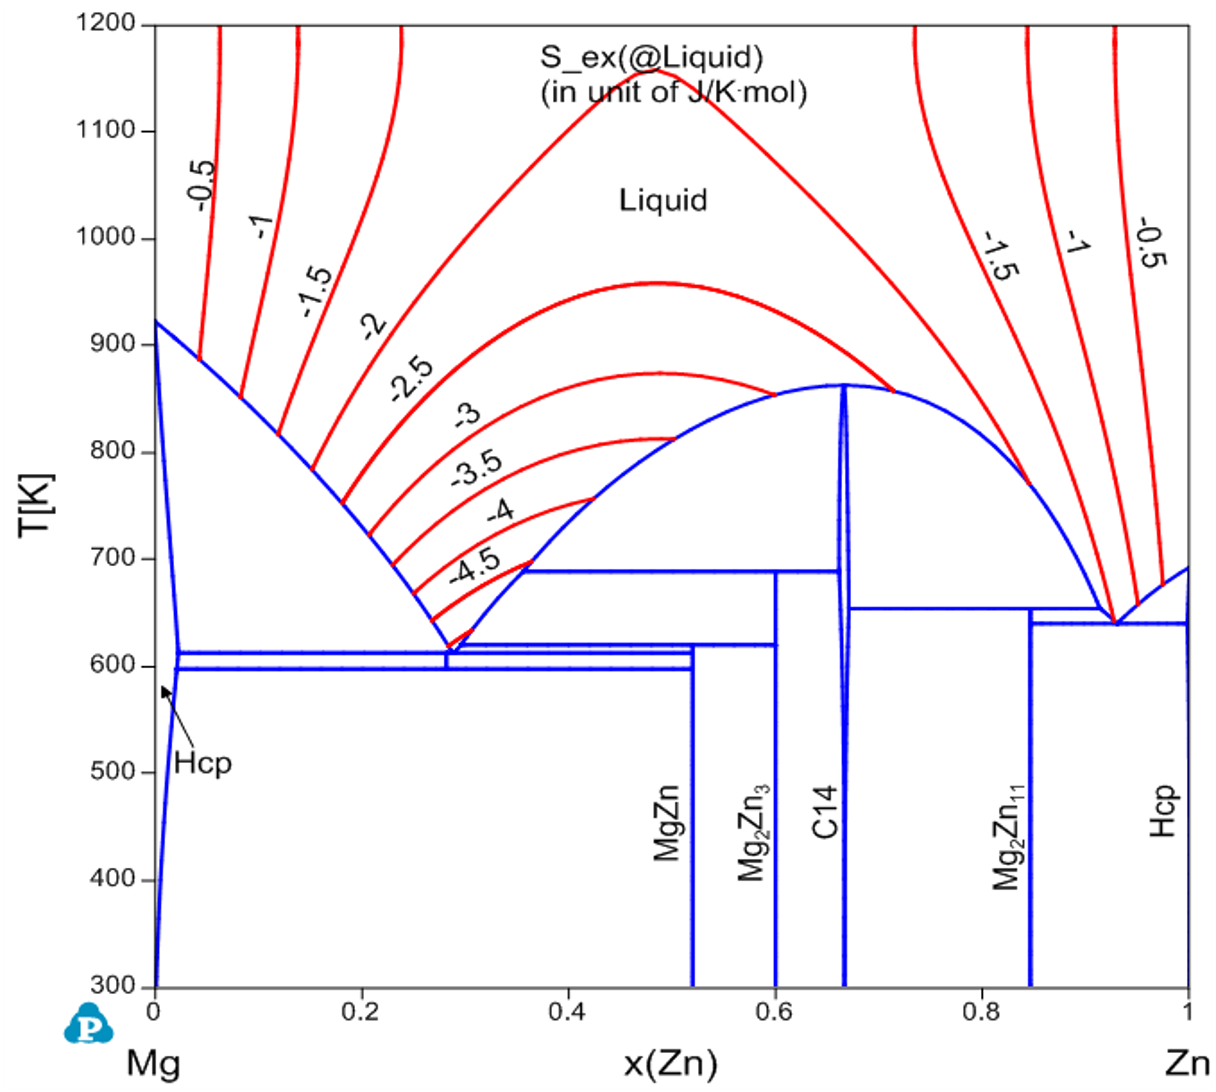
Figure 3.55: Contour diagram of the excess entropy in the liquid phase of Mg-Zn system