Example 1.18: Temperature-Pressure Diagram
Purpose: Learn to calculate a Temperature-Pressure diagram. In this example, a Temperature-Pressure diagram is calculated for pure Fe component.
Module: PanPhaseDiagram
Thermodynamic Database: Fe_Demo.rtdb
Batch file: Example_#1.18.pbfx
Calculation Procedures:
- Load Fe_Demo.rtdb following the procedure in Pandat User’s Guide: Load Database,and select Fe component;
- Perform a Section Calculation from PanPhaseDiagram, and set the calculation condition as shown in Figure 1.18.1;
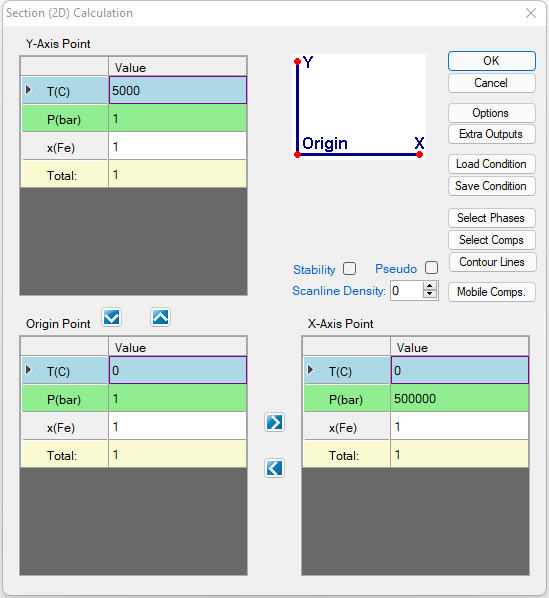
Figure 1.18.1: Setup calculation of T-P diagram for pure Fe, x-axis is P and y-axis is T
- Click the “Select Phases” icon, then suspend the “Sigma” phase by selecting it and clicking the
 icon to move it to the “Suspended Phases” column, as shown in Figure 1.18.2; Note: Only phases that include pressure-dependent terms should be selected for temperature–pressure phase diagram calculations.
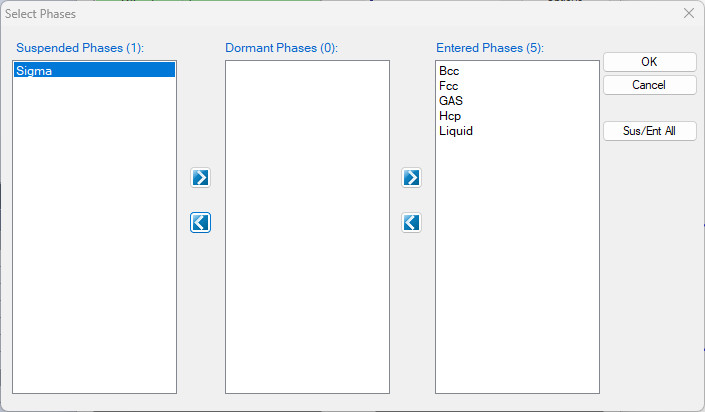
Figure 1.18.2: Only select the phases with pressure terms
Post Calculation Operation:
- Change graph appearance following the procedure in Pandat User’s Guide: Property;
- Label the graph following the procedure in Pandat User’s Guide: Icons for Graph on Toolbar;
Information obtained from this calculation:
- Figure 1.18.3 shows the default plot when calculation is finished, it is T-log10(P). It clearly demonstrates the stability of each phase at different temperature and pressure;
- Detailed information on the three-phase reactions, i.e., the temperatures and pressures at triple points can be found in the “invariant” table;
- From Default table, other plots, such as T-P diagram, can be plotted as shown in Figure 1.18.4;
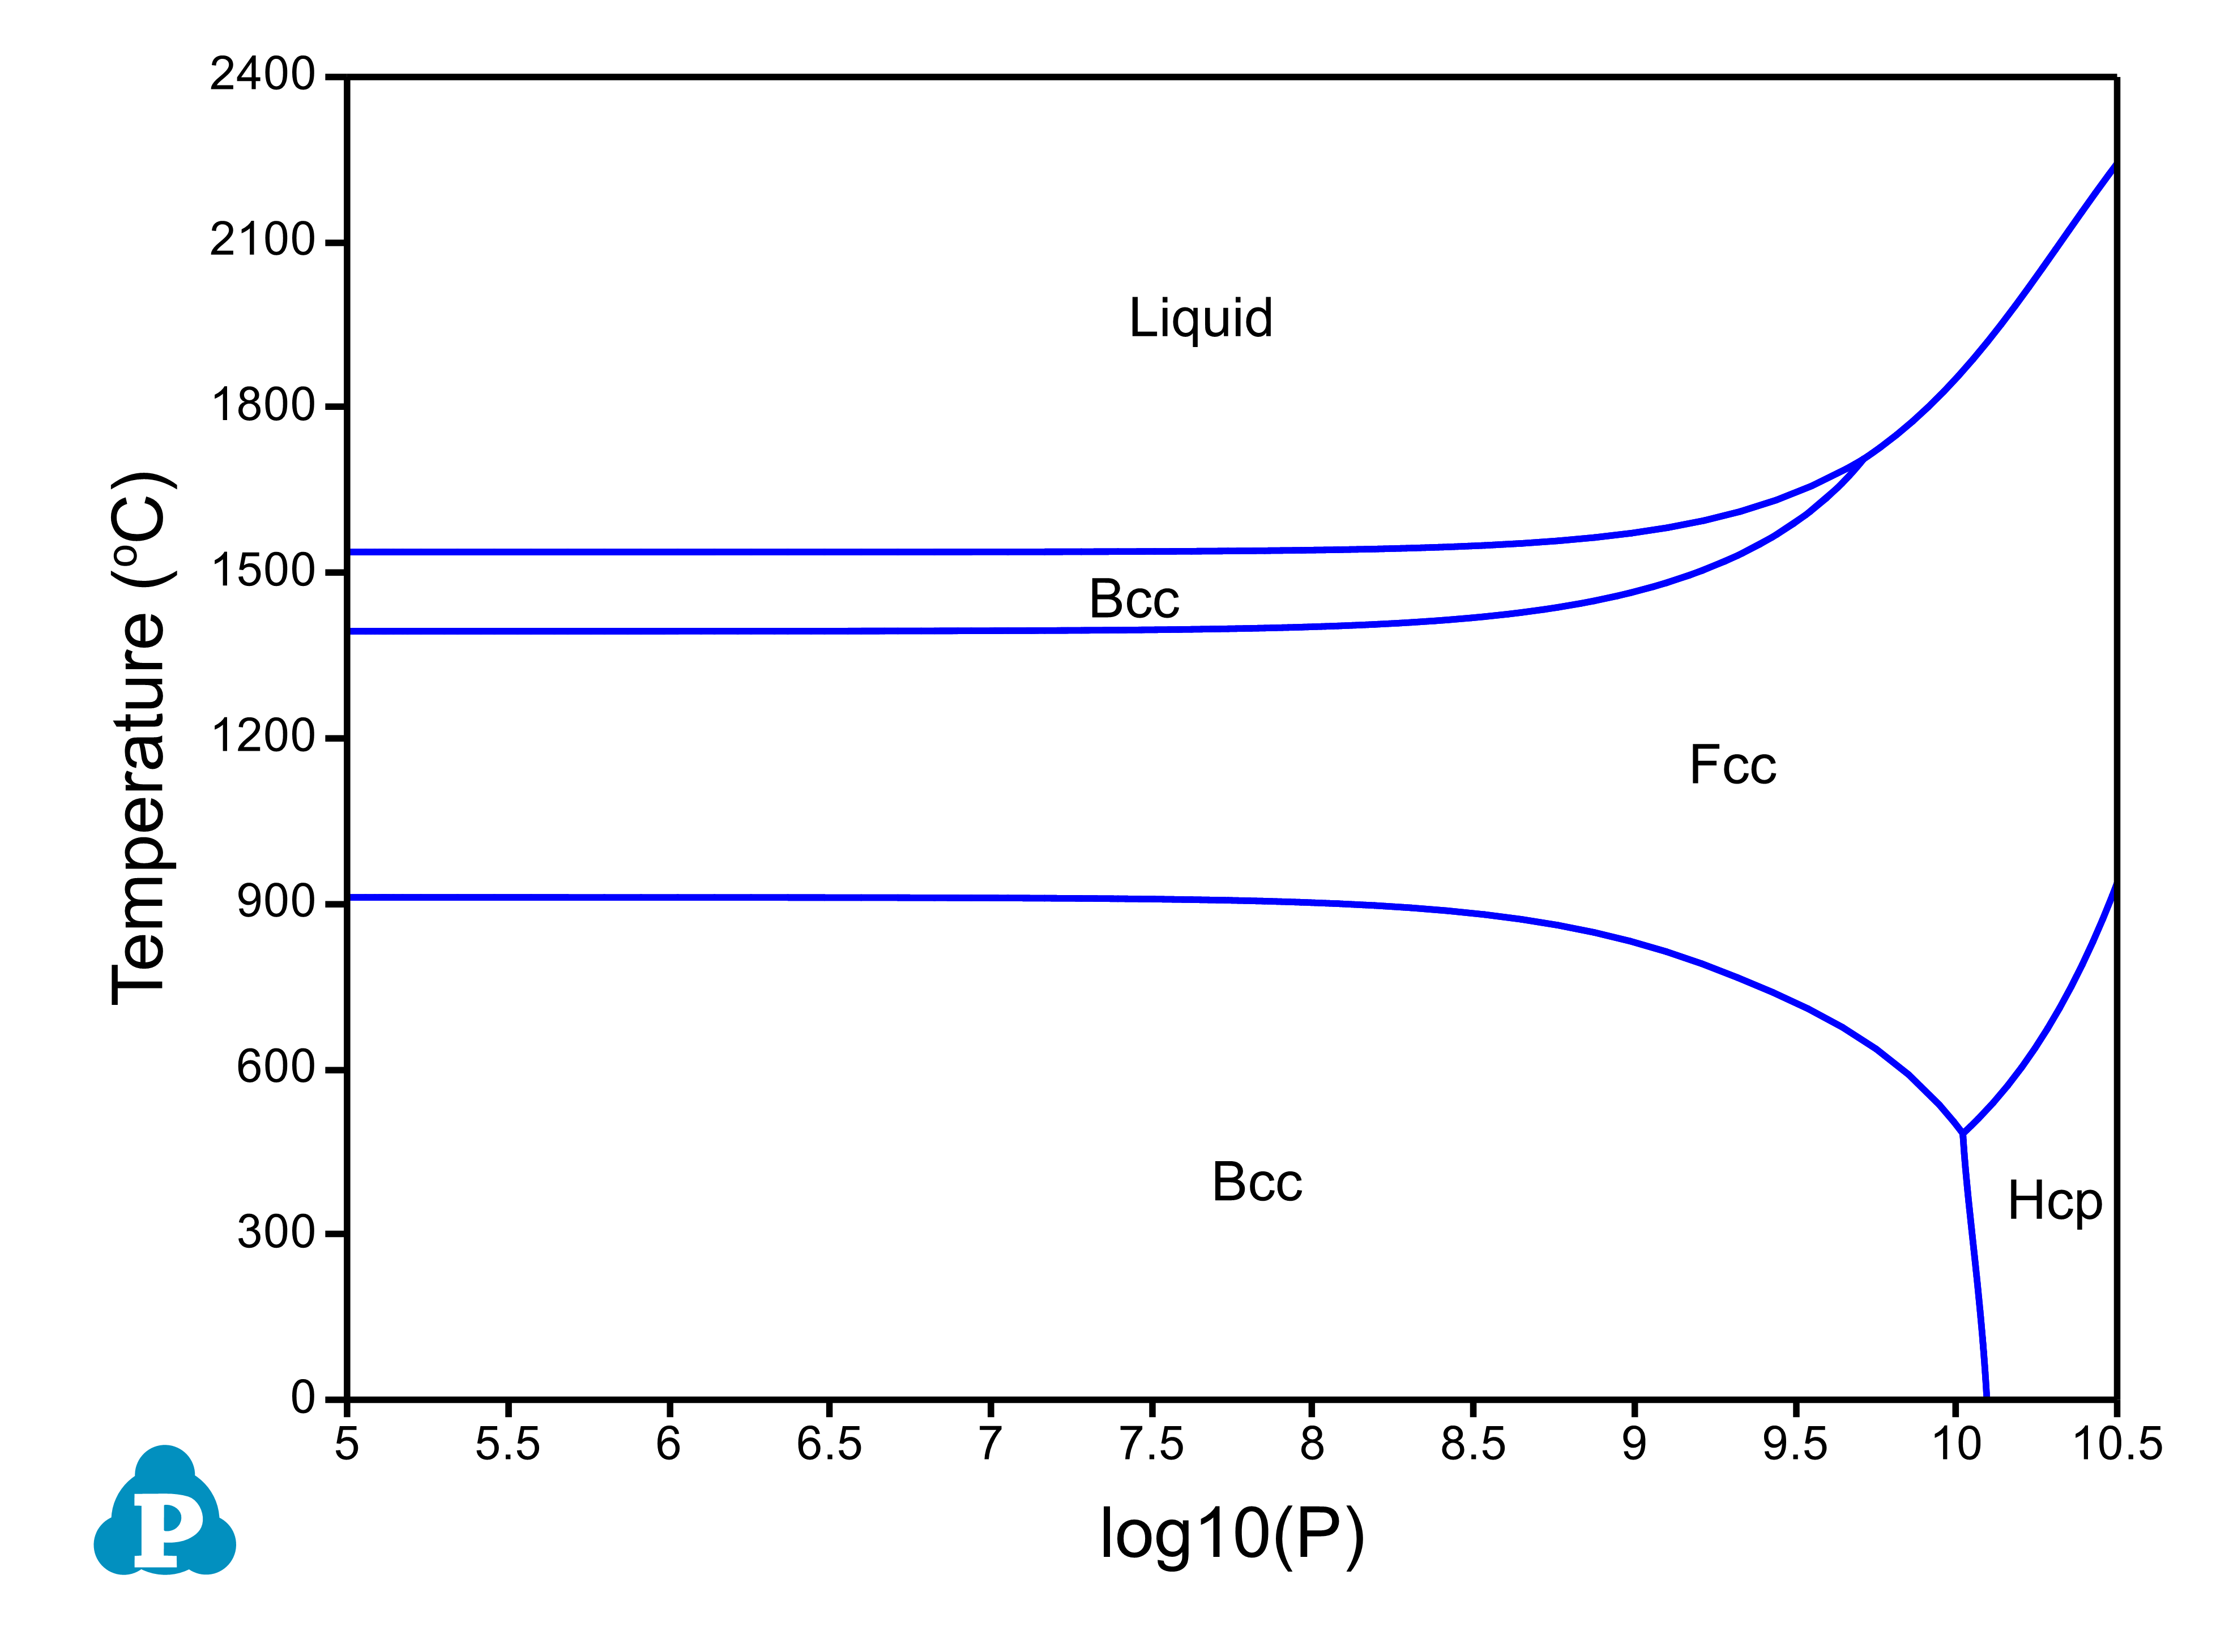
Figure 1.18.3: Temperature-log (Pressure) diagram for pure Fe component
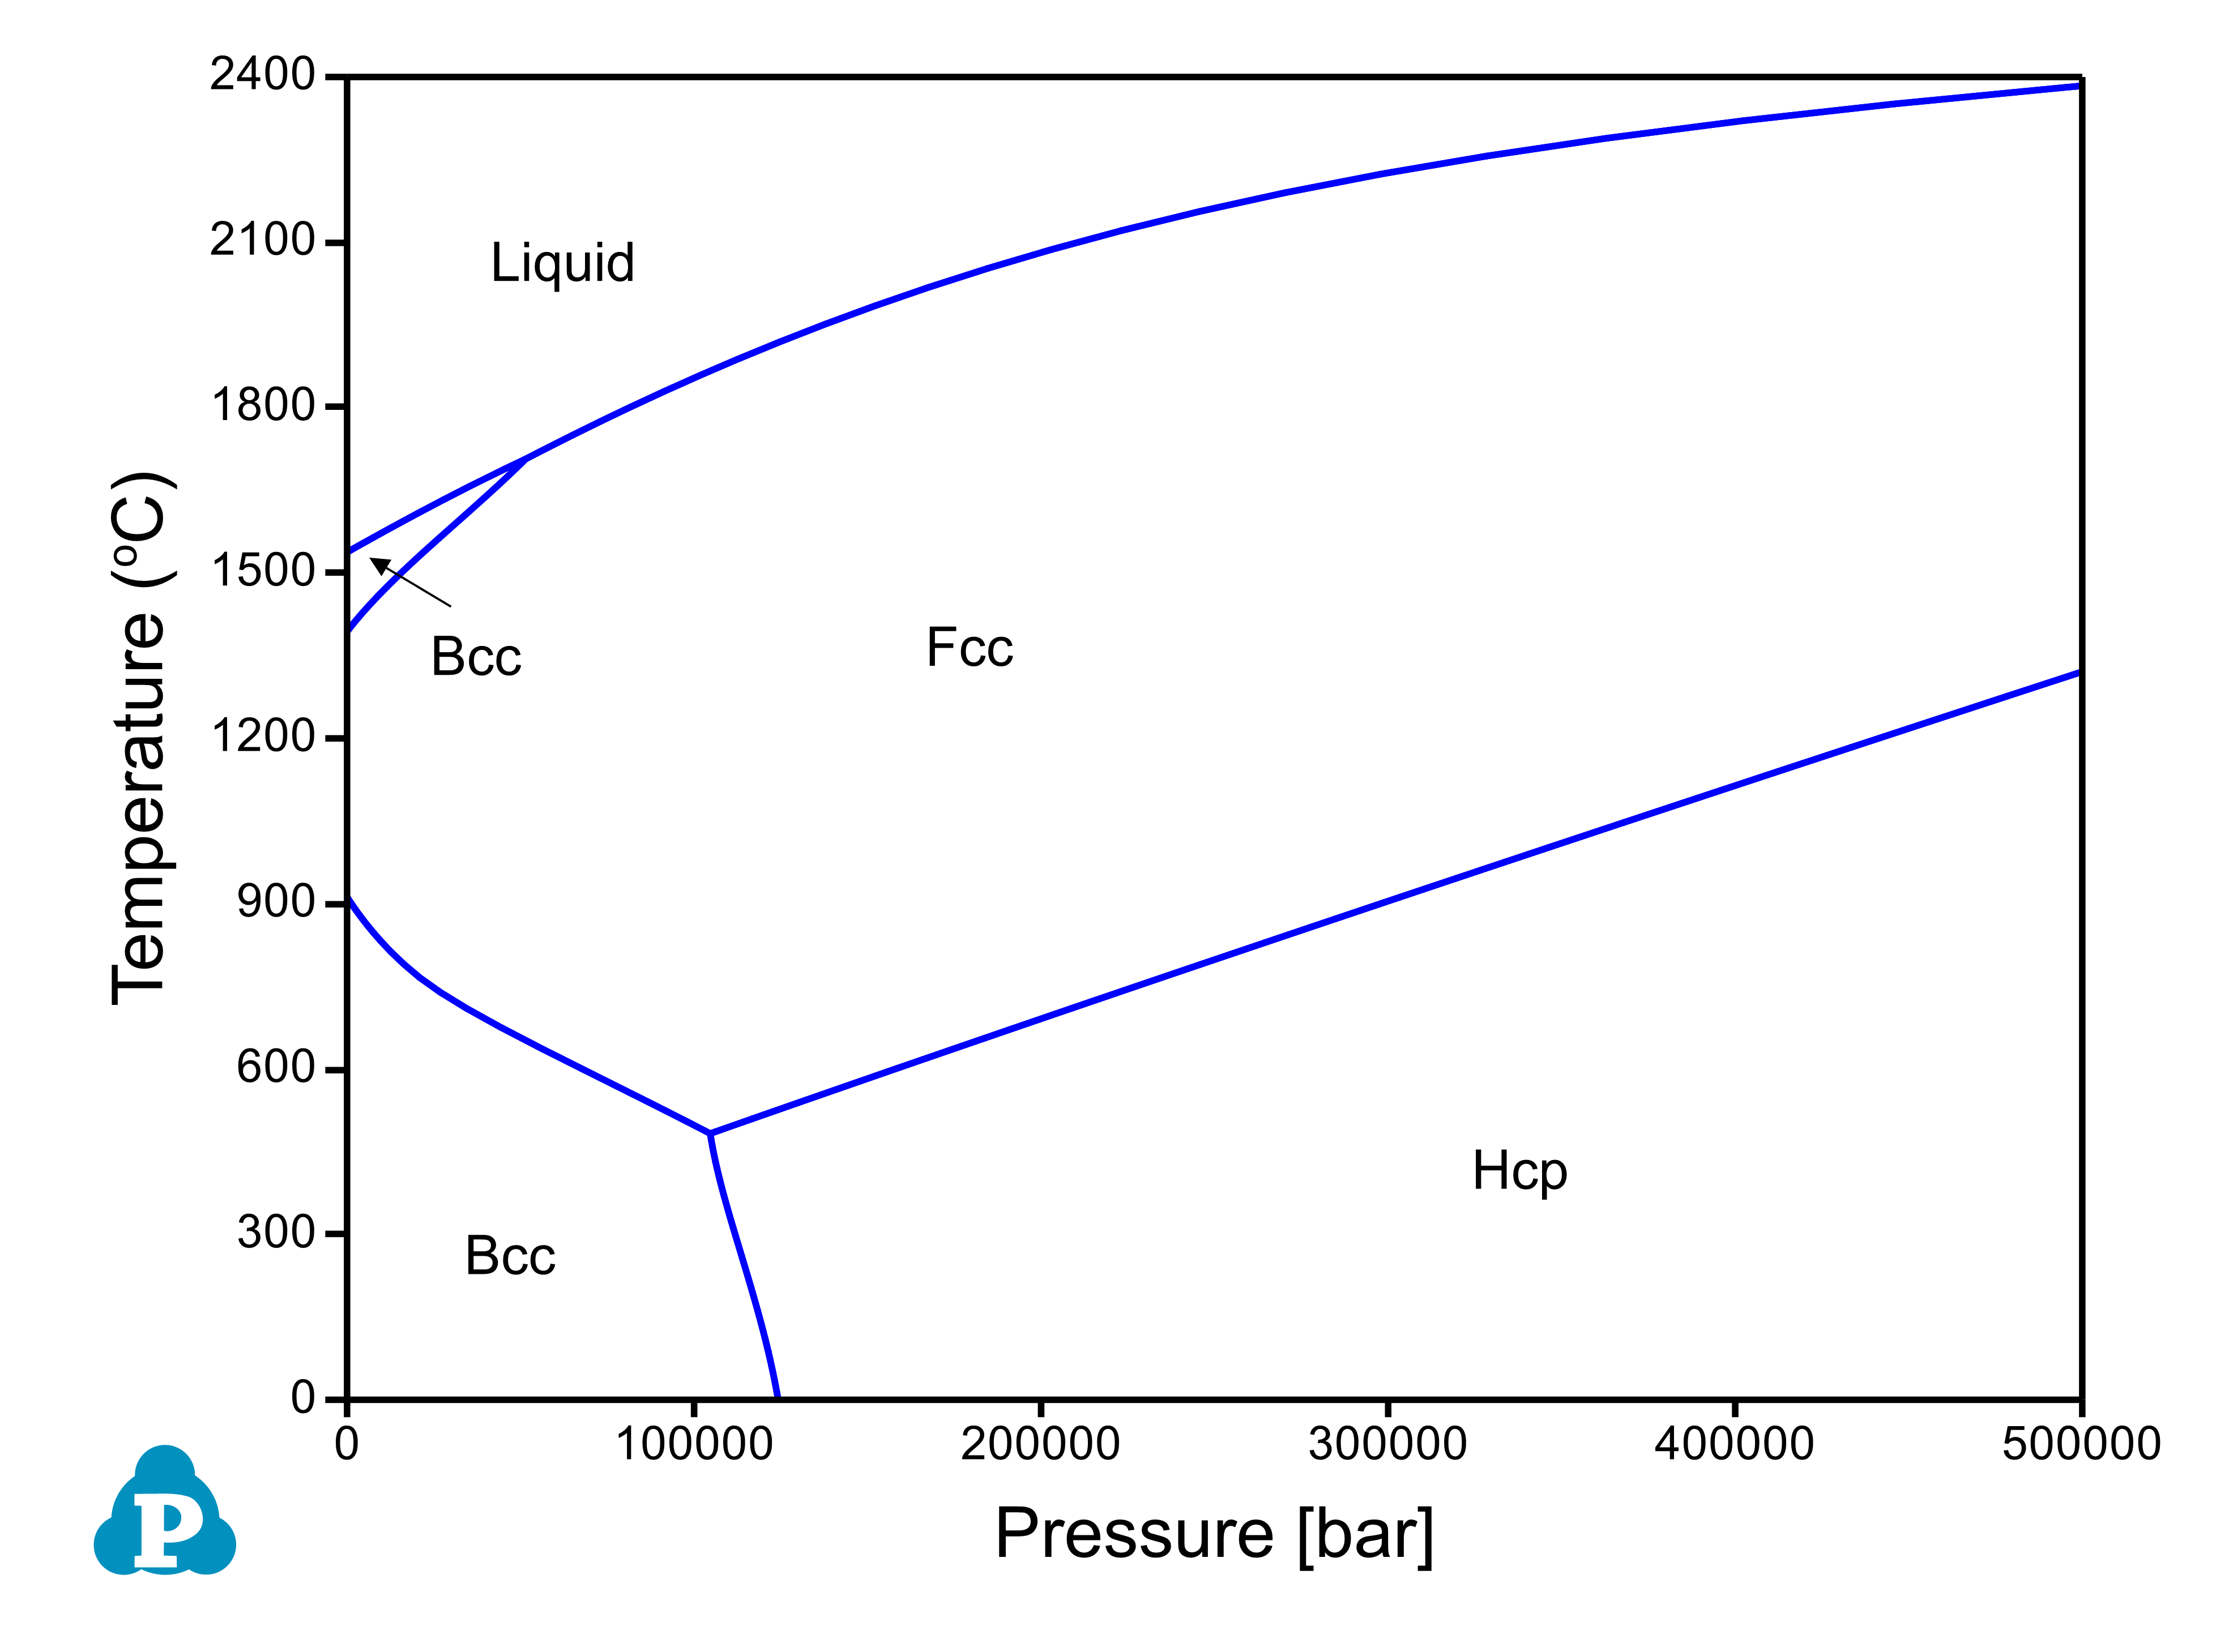
Figure 1.18.4: Temperature-Pressure diagram for pure Fe component