Example 5.2: Prediction of Hot Cracking Susceptibility of an Al-Cu-Mg Alloy
Purpose: Learn to perform solidification simulation to predict the hot cracking susceptibility index of an alloy in PanSolidification Module.
Module: PanSolidification
Thermodynamic and Mobility Database: Al_Demo.rtdb
Kinetic Parameters Database: Al_Alloys.sdb
Batch file: Example_#5.2.pbfx
Hot tearing, also known as hot cracking, is a serious defect that can occur during welding and solidification in casting processes. It typically forms at the final stage of solidification, often along grain boundaries. To quantify the susceptibility to hot cracking, Prof. Sindo Kou [2005Kou] proposed a crack susceptibility index (CSI), defined as the maximum value of|dT/d(fs)1/2| at (fs)1/2 < 0.99. This criterion has been successfully applied to several aluminum alloy systems. In this example, users will learn how to perform a solidification simulation for an Al-Cu-Mg alloy and directly output the relationship between |dT/d(fs)1/2| and (fs)1/2 which allows determination of the alloy’s CSI value. The example also demonstrates how to configure additional output tables for specific properties and generate extra output plots.
Calculation Procedures:
- Create a workspace and select the module following Pandat User’s Guide: Workspace;
- Load Al_Demo.rtdb through menu "Database → Load TDB or PDB" or by click icon
 , and then select Al, Cu and Mg three components;
 - Load SDB file Al_Alloys.sdb through menu "PanSolidification → Load SDB" or by click icon
 , select the available alloys: Al alloys.
 - Set Solidification simulation conditions as shown in Figure 5.2.1. The alloy composition is Al-5wt.%Cu-2wt.%Mg. The cooling rate is 20 K/s is setting in Thermal History solidifying from 680 °C to 380 °C with 15 second. Temperature gradient is set as 10-3 °C/μm. Please pay attention to the units of the time and length when set conditions.
- Set the “Extra Outputs table”. Click “Extra Outputs” in Figure 5.2.1 to open a new interface, as shown in Figure 5.2.2. Then click the blue “+” symbol in Figure 5.2.2 to pop out the Table Editor as shown in Figure 5.2.3. In the Table Editor, users can easily drag and drop properties from the left panel into the Columns area on the right, such as time, temperature (T), and CSI. Users may also manually enter properties, for example sqrt(fs). In Pandat, CSI is defined as -dT/d(fs)1/2. After completing these settings, an additional output table will be generated alongside the Default table.
- Set “Extra Outputs graph”. Click the icon “Graph” in “Set extra output” interface as shown in Figure 5.2.2, then click the blue “+” symbol to add extra Graph. An interface as shown in Figure 5.2.4 will appear. Select the “generated” table generated by the previous step. Drag sqrt(fs) from the left column to X axis in the right column; drag CSI from the left column to Y axis in the right column. Then click OK. With this setup, a CSI vs. sqrt(fs) graph "CSI" will be plotted automatically, in addition to the Default graph.
- Then Click OK to perform Solidification simulation. (Detailed description also in Pandat User’s Guide: Tutorial).
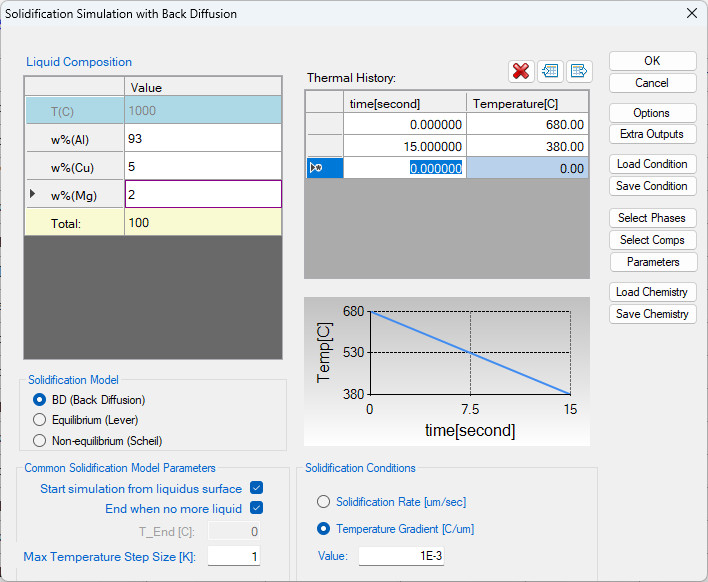
Figure 5.2.1: Set up conditions for solidification simulation
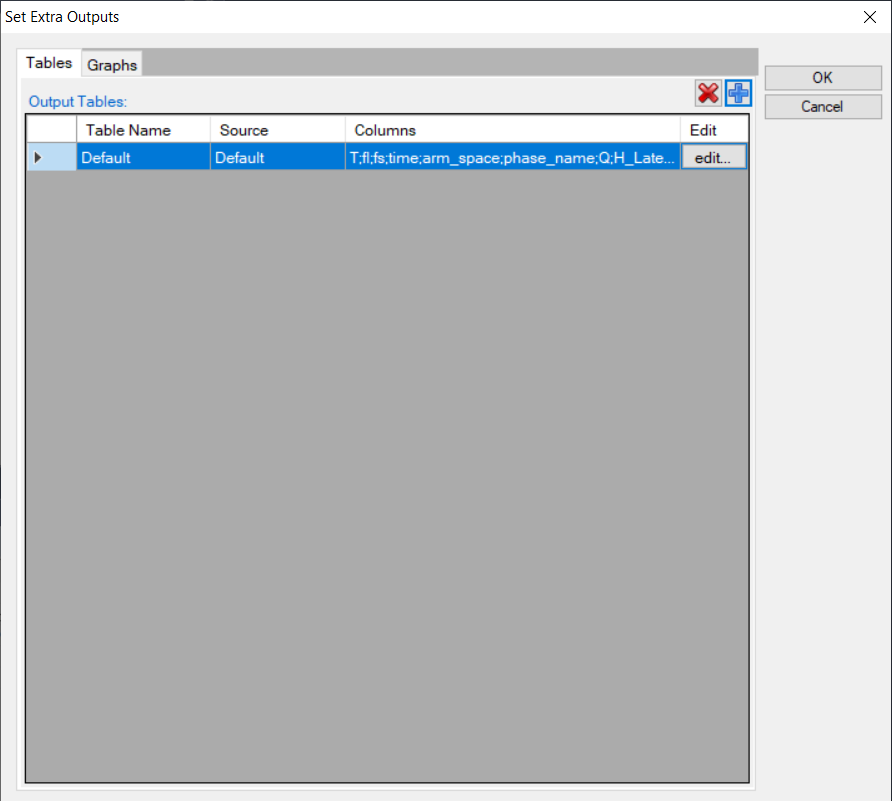
Figure 5.2.2: Extra Output interface
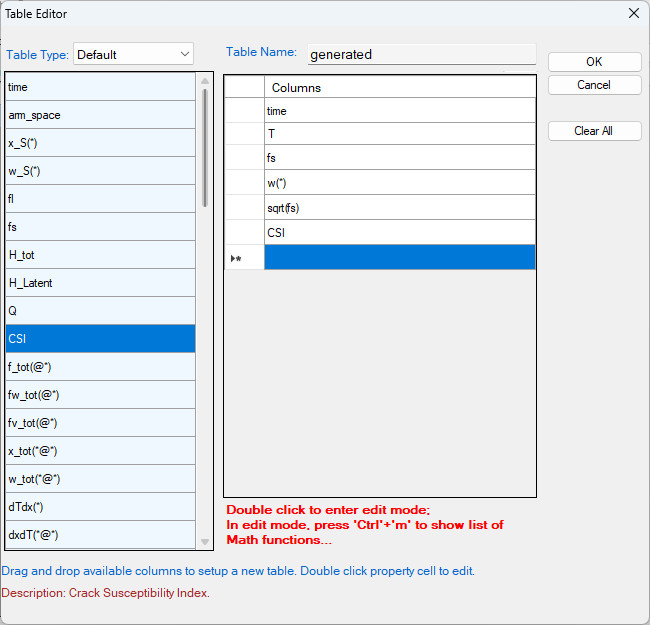
Figure 5.2.3: Define properties in the extra output table
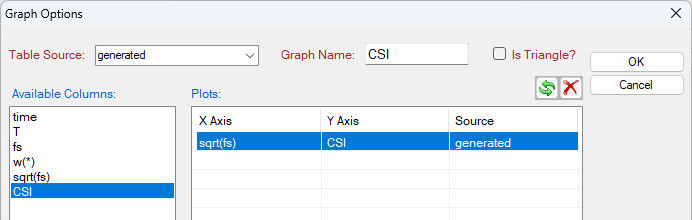
Figure 5.2.4: Define the axes of the extra graph
Post Calculation Operation:
- The default plot presents the relationship between fraction of solid (fs) and temperature during solidification as shown in Figure 5.2.5.
- The extra graph specified is plotted automatically as shown in Figure 5.2.6.
- Rescale Figure 5.2.6. as shown in Figure 5.2.7. The hot cracking susceptibility index (CSI) is defined as the maximum value of -dT/d(fs)1/2with (fs)1/2 < 0.99.
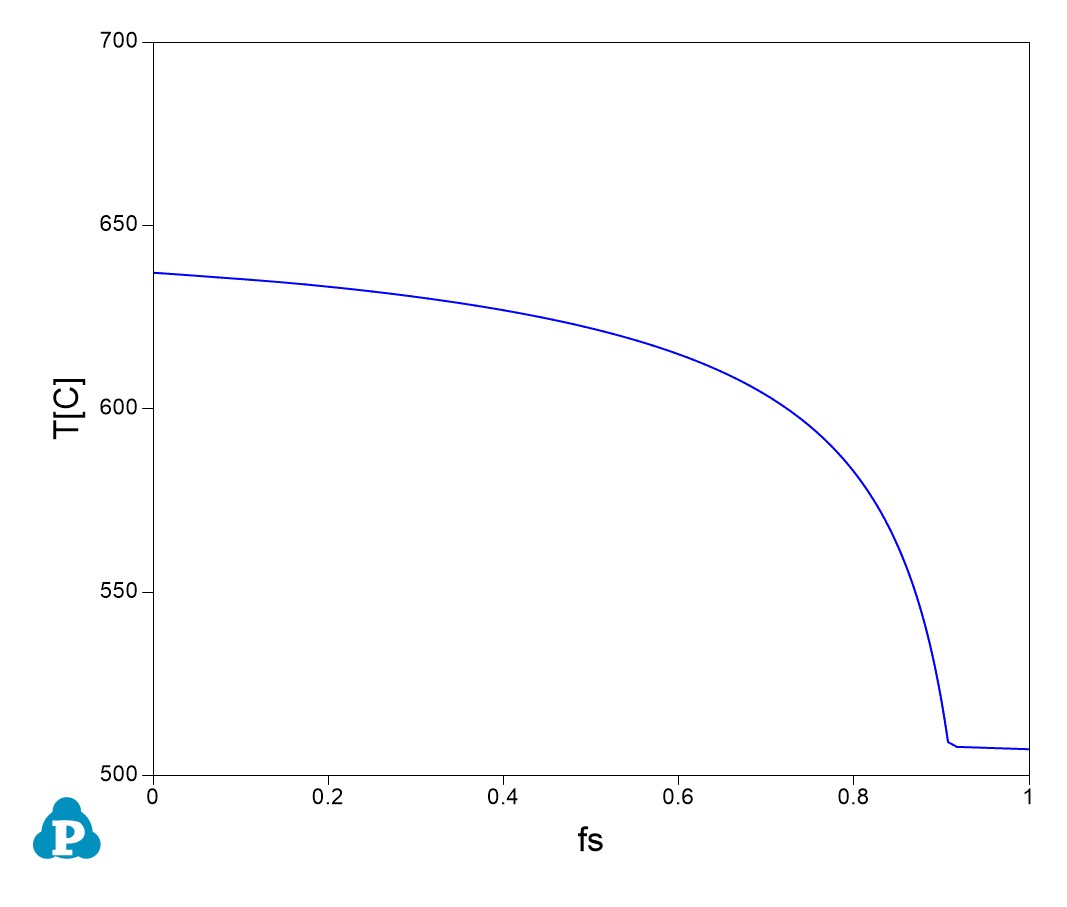
Figure 5.2.5: Default plot showing the relation between temperature and fraction of solid
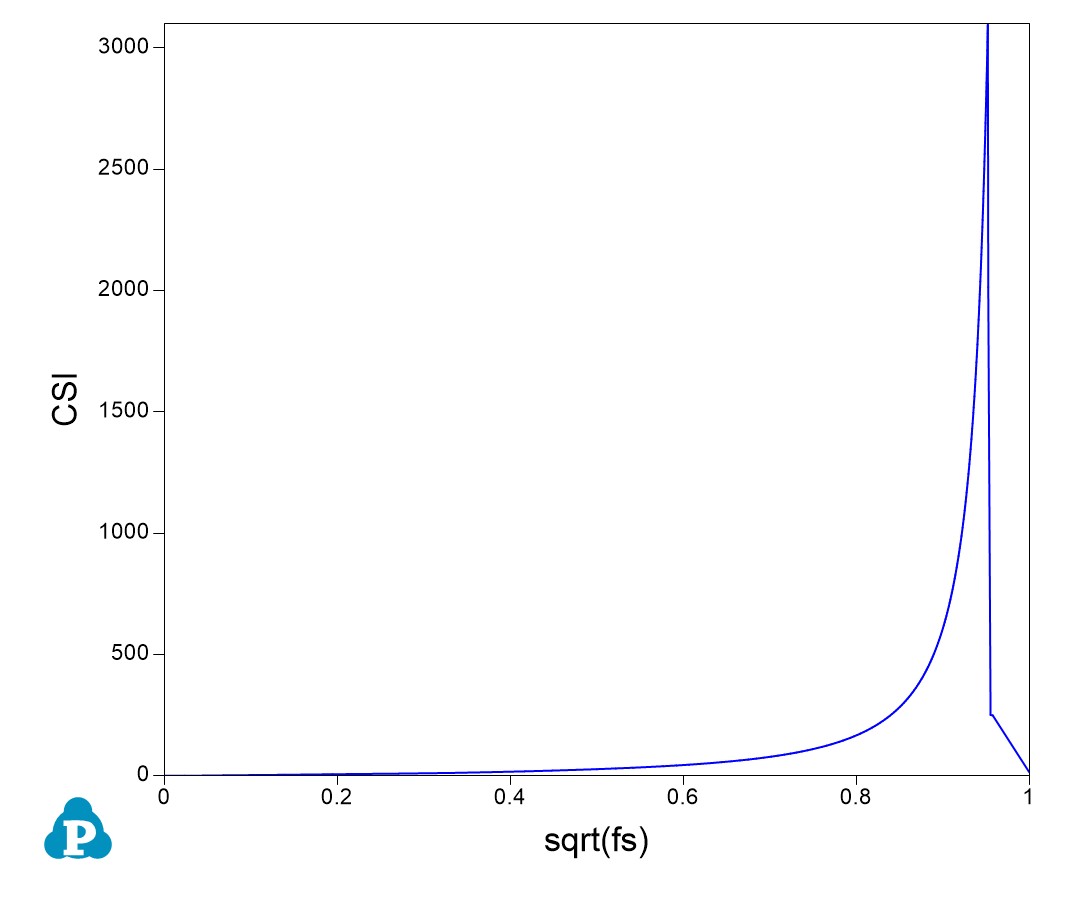
Figure 5.2.6: Extra plot specified by Extra Graph setting
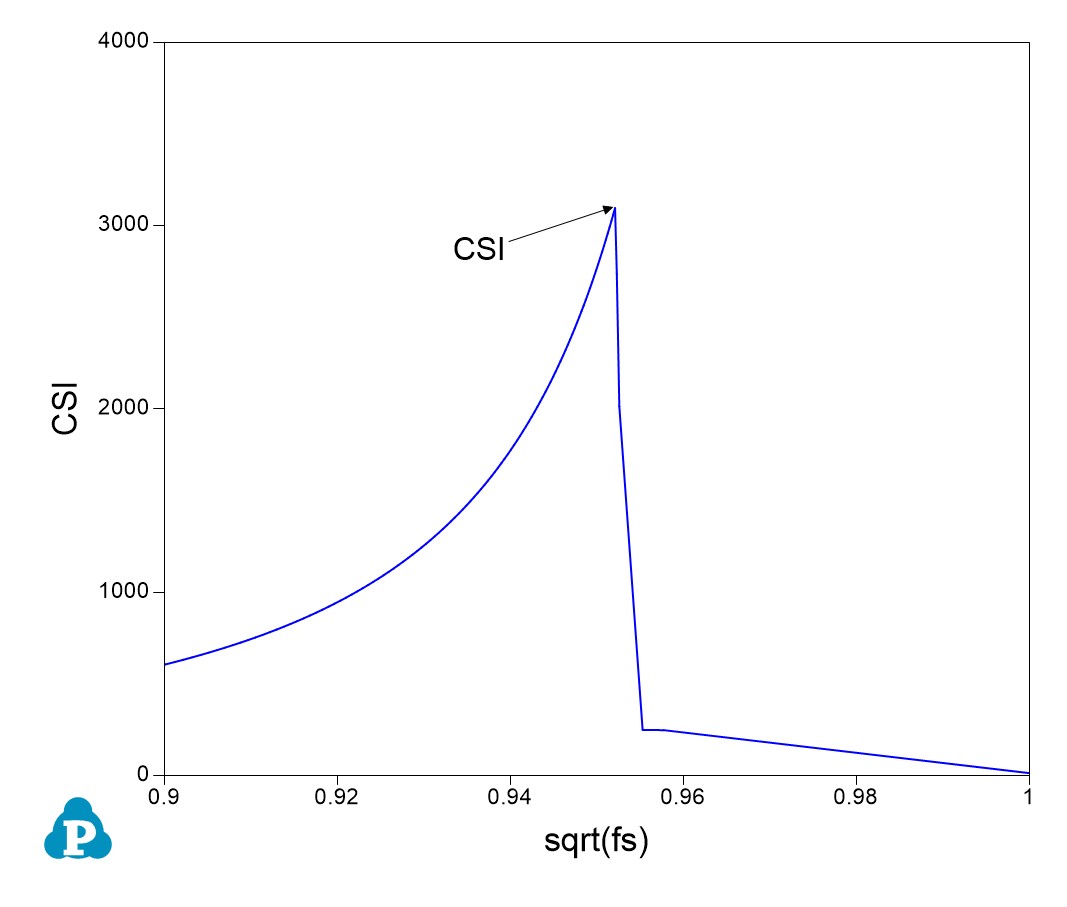
Figure 5.2.7: Rescale of Figure 5.2.6 showing the maximum point of CSI with sqrt(fs) < 0.99.