Example 1.16: Pressure Contour Diagram
Purpose: Learn to calculate pressure contour diagram. In this example, the pressure contour lines of total pressure and partial pressure of N2 in the Ti-N system will be calculated and plotted on the Ti-N binary phase diagram.
Module: PanphaseDiagram
Thermodynamic Database: TiN_Gas_Pressure.tdb
Batch file: Example_#1.16.pbfx
Calculation Procedures:
- Load TiN_Gas_Pressure.tdb following the procedure in Pandat User’s Guide: Load Database, and select both Ti, Ni components;
- First set up the calculation condition as shown in Figure 1.16.1 for calculating Ti-N binary phase diagram, then click “Contour Lines” to open the contour line dialog as shown in Figure 1.16.2;
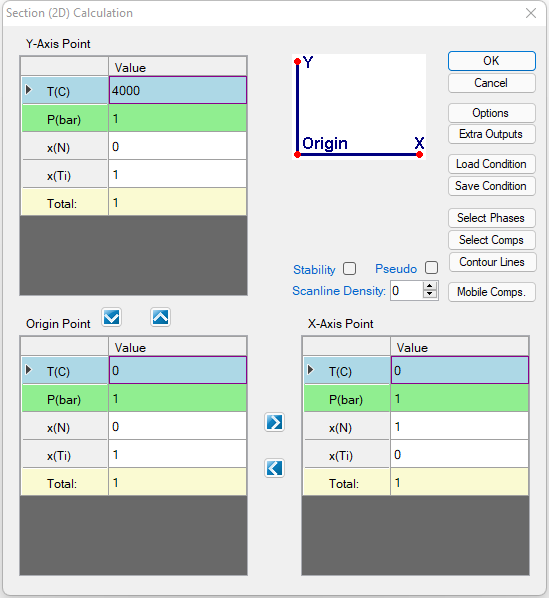
Figure 1.16.1: Setup calculation for Ti-N binary phase diagram, then click "Contour Lines"
- Choose “User Custom Type” and click Add. Type in “log(P(@gas))” for the Contour Type in the “Properties” window as shown in Figure 1.16.2, then press OK;
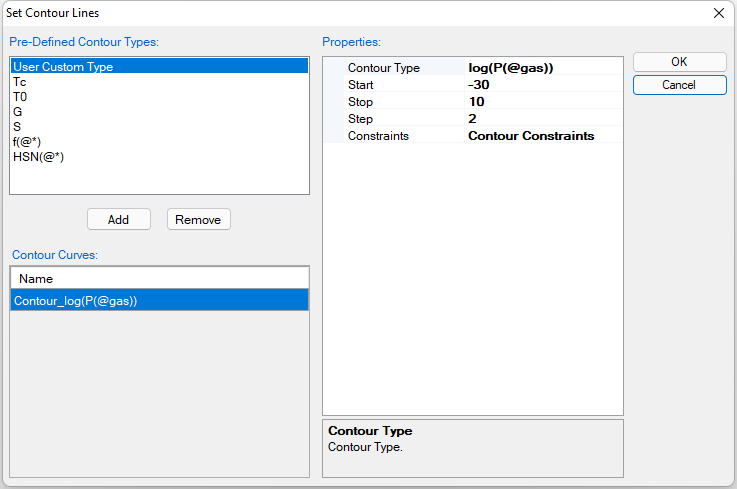
Figure 1.16.2: Type in “log(P(@gas))” for the Contour Type in the “Properties” window, it is to calculate the total pressure contour lines from logP = -30 to 10 with step 2
Post Calculation Operation:
- Change graph appearance following the procedure in Pandat User’s Guide: Property;
- Label each line by putting the cursor on each line and wait for the tool tip to pop out, then press F2;
Information obtained from this calculation:
- Figure 1.16.3 shows the contour diagram of total pressure in Ti-N system;
- If we type in “log(P(N2@gas))” as the Contour Type in the “Properties” window in Figure 1.16.2, we will obtained the contour diagram for partial pressure logP(N2) as shown in Figure 1.16.4;
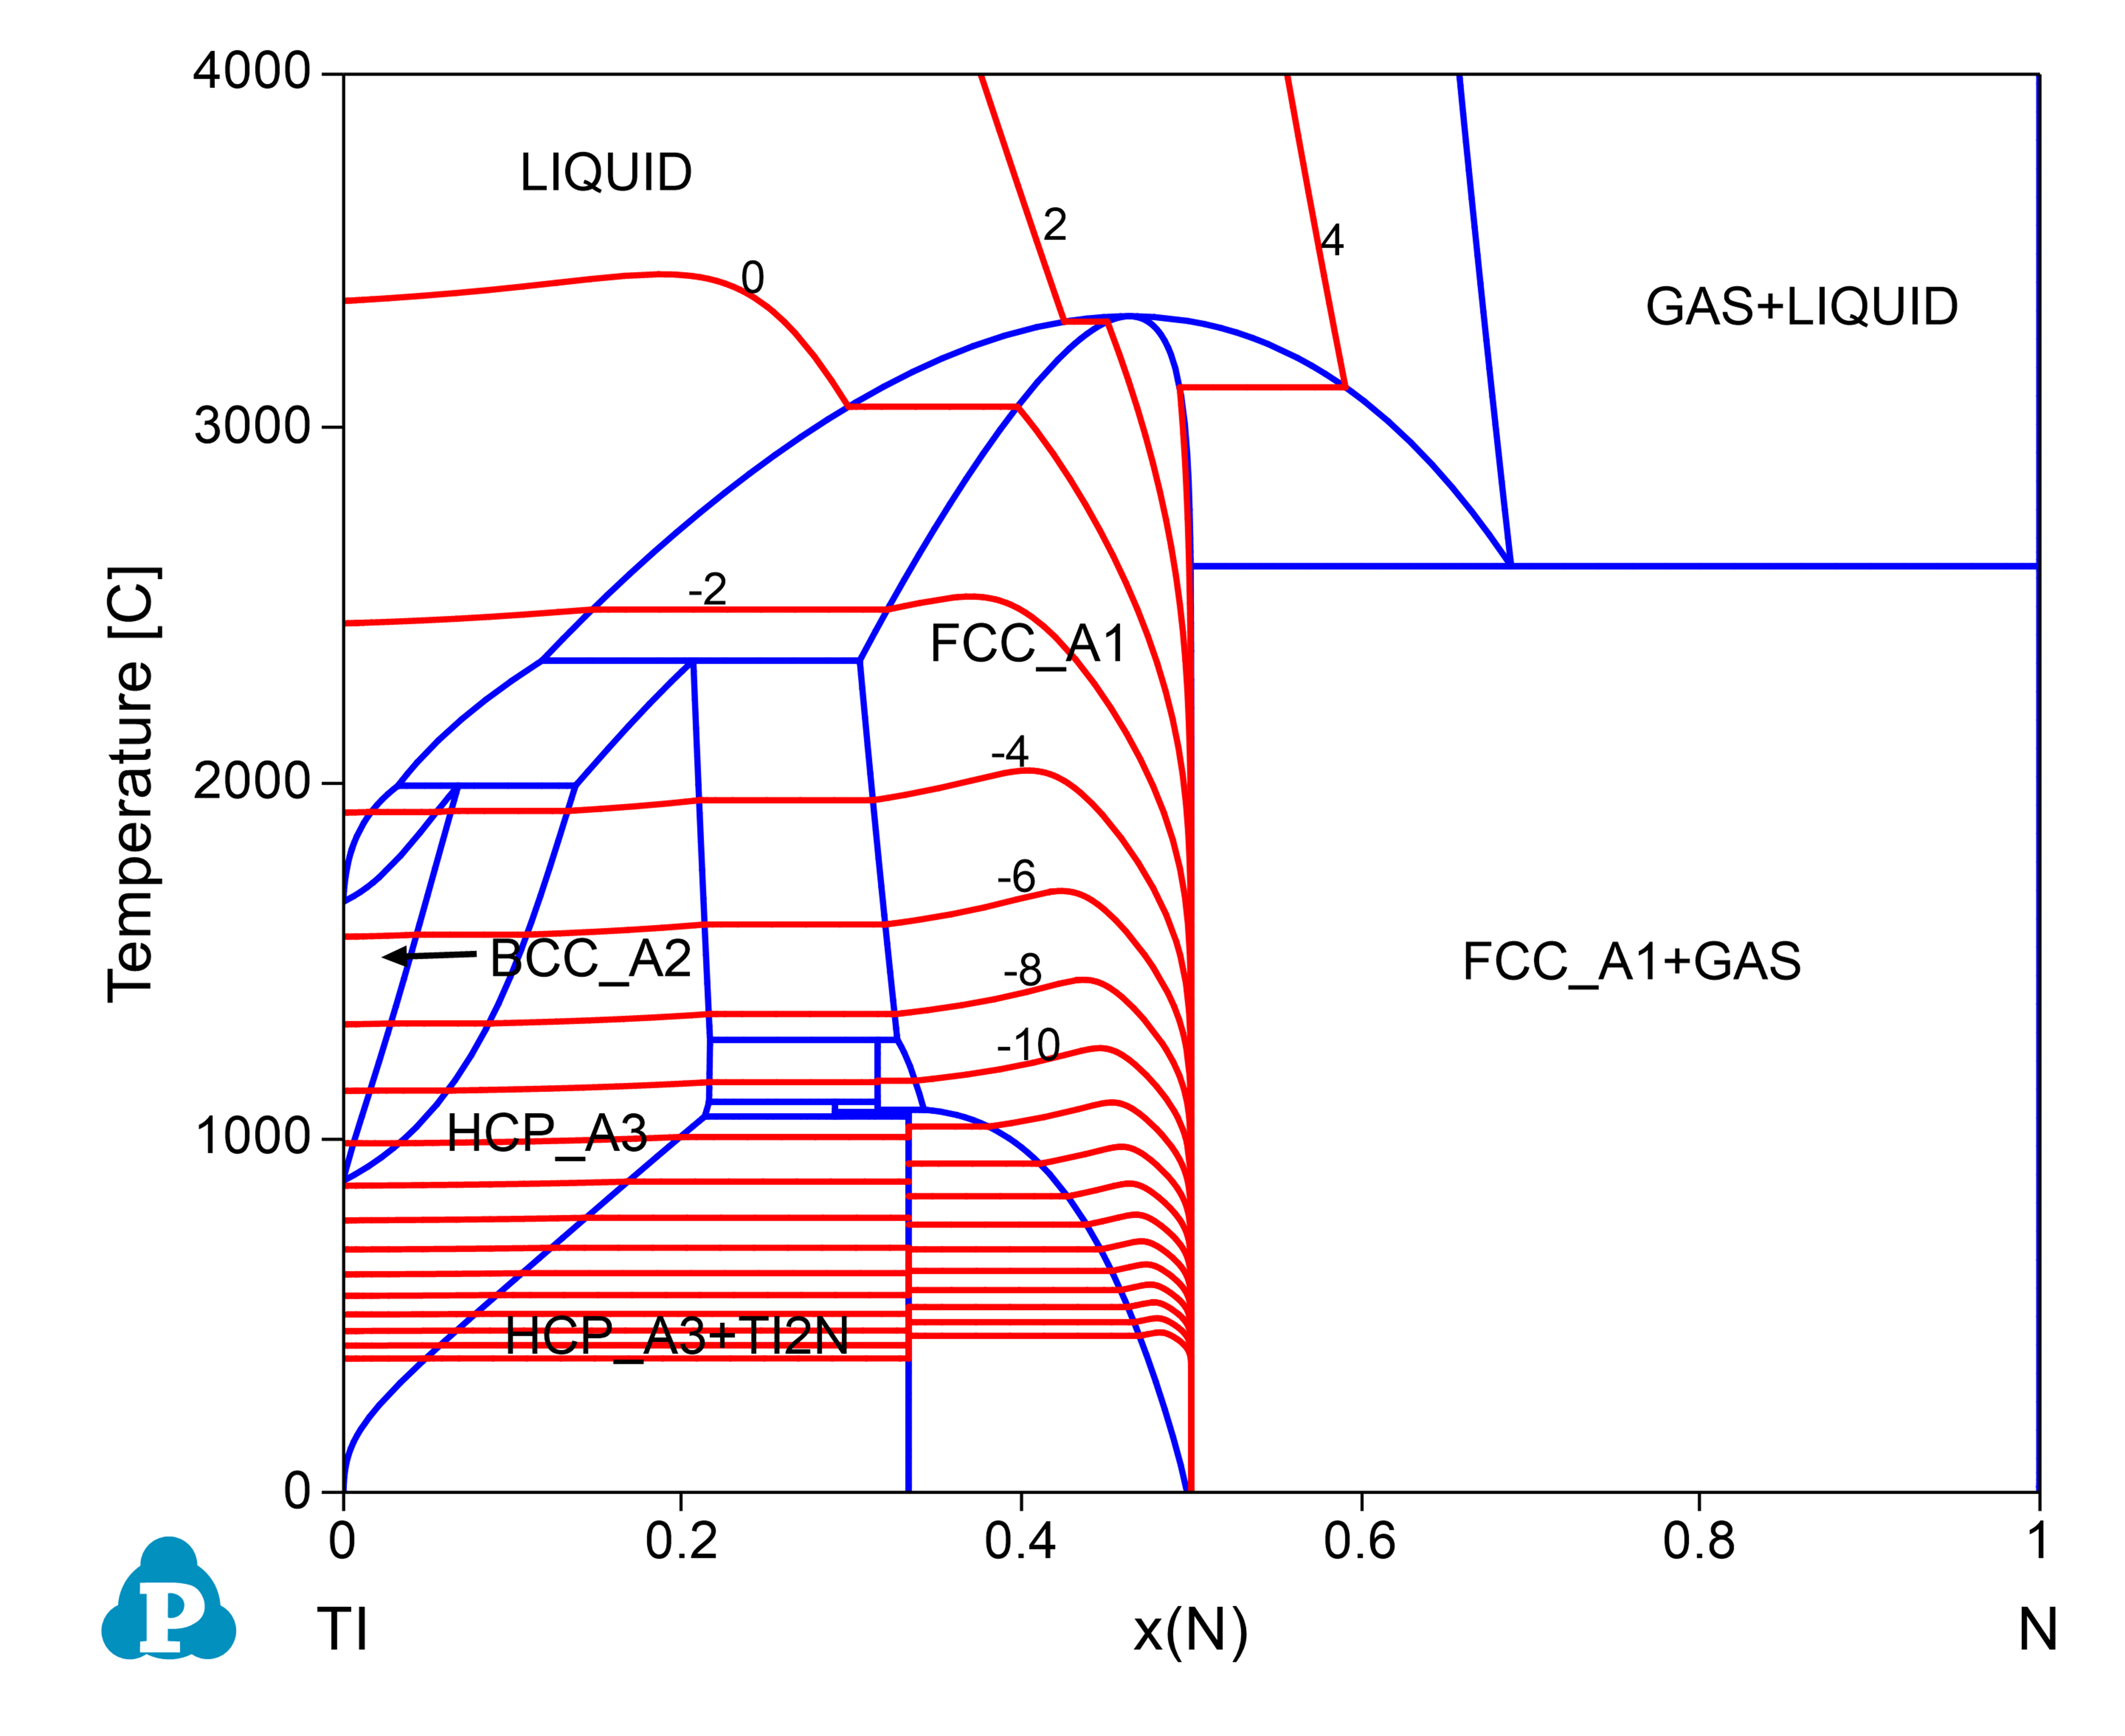
Figure 1.16.3: Calculated contour diagram of total pressure in the Ti-N system
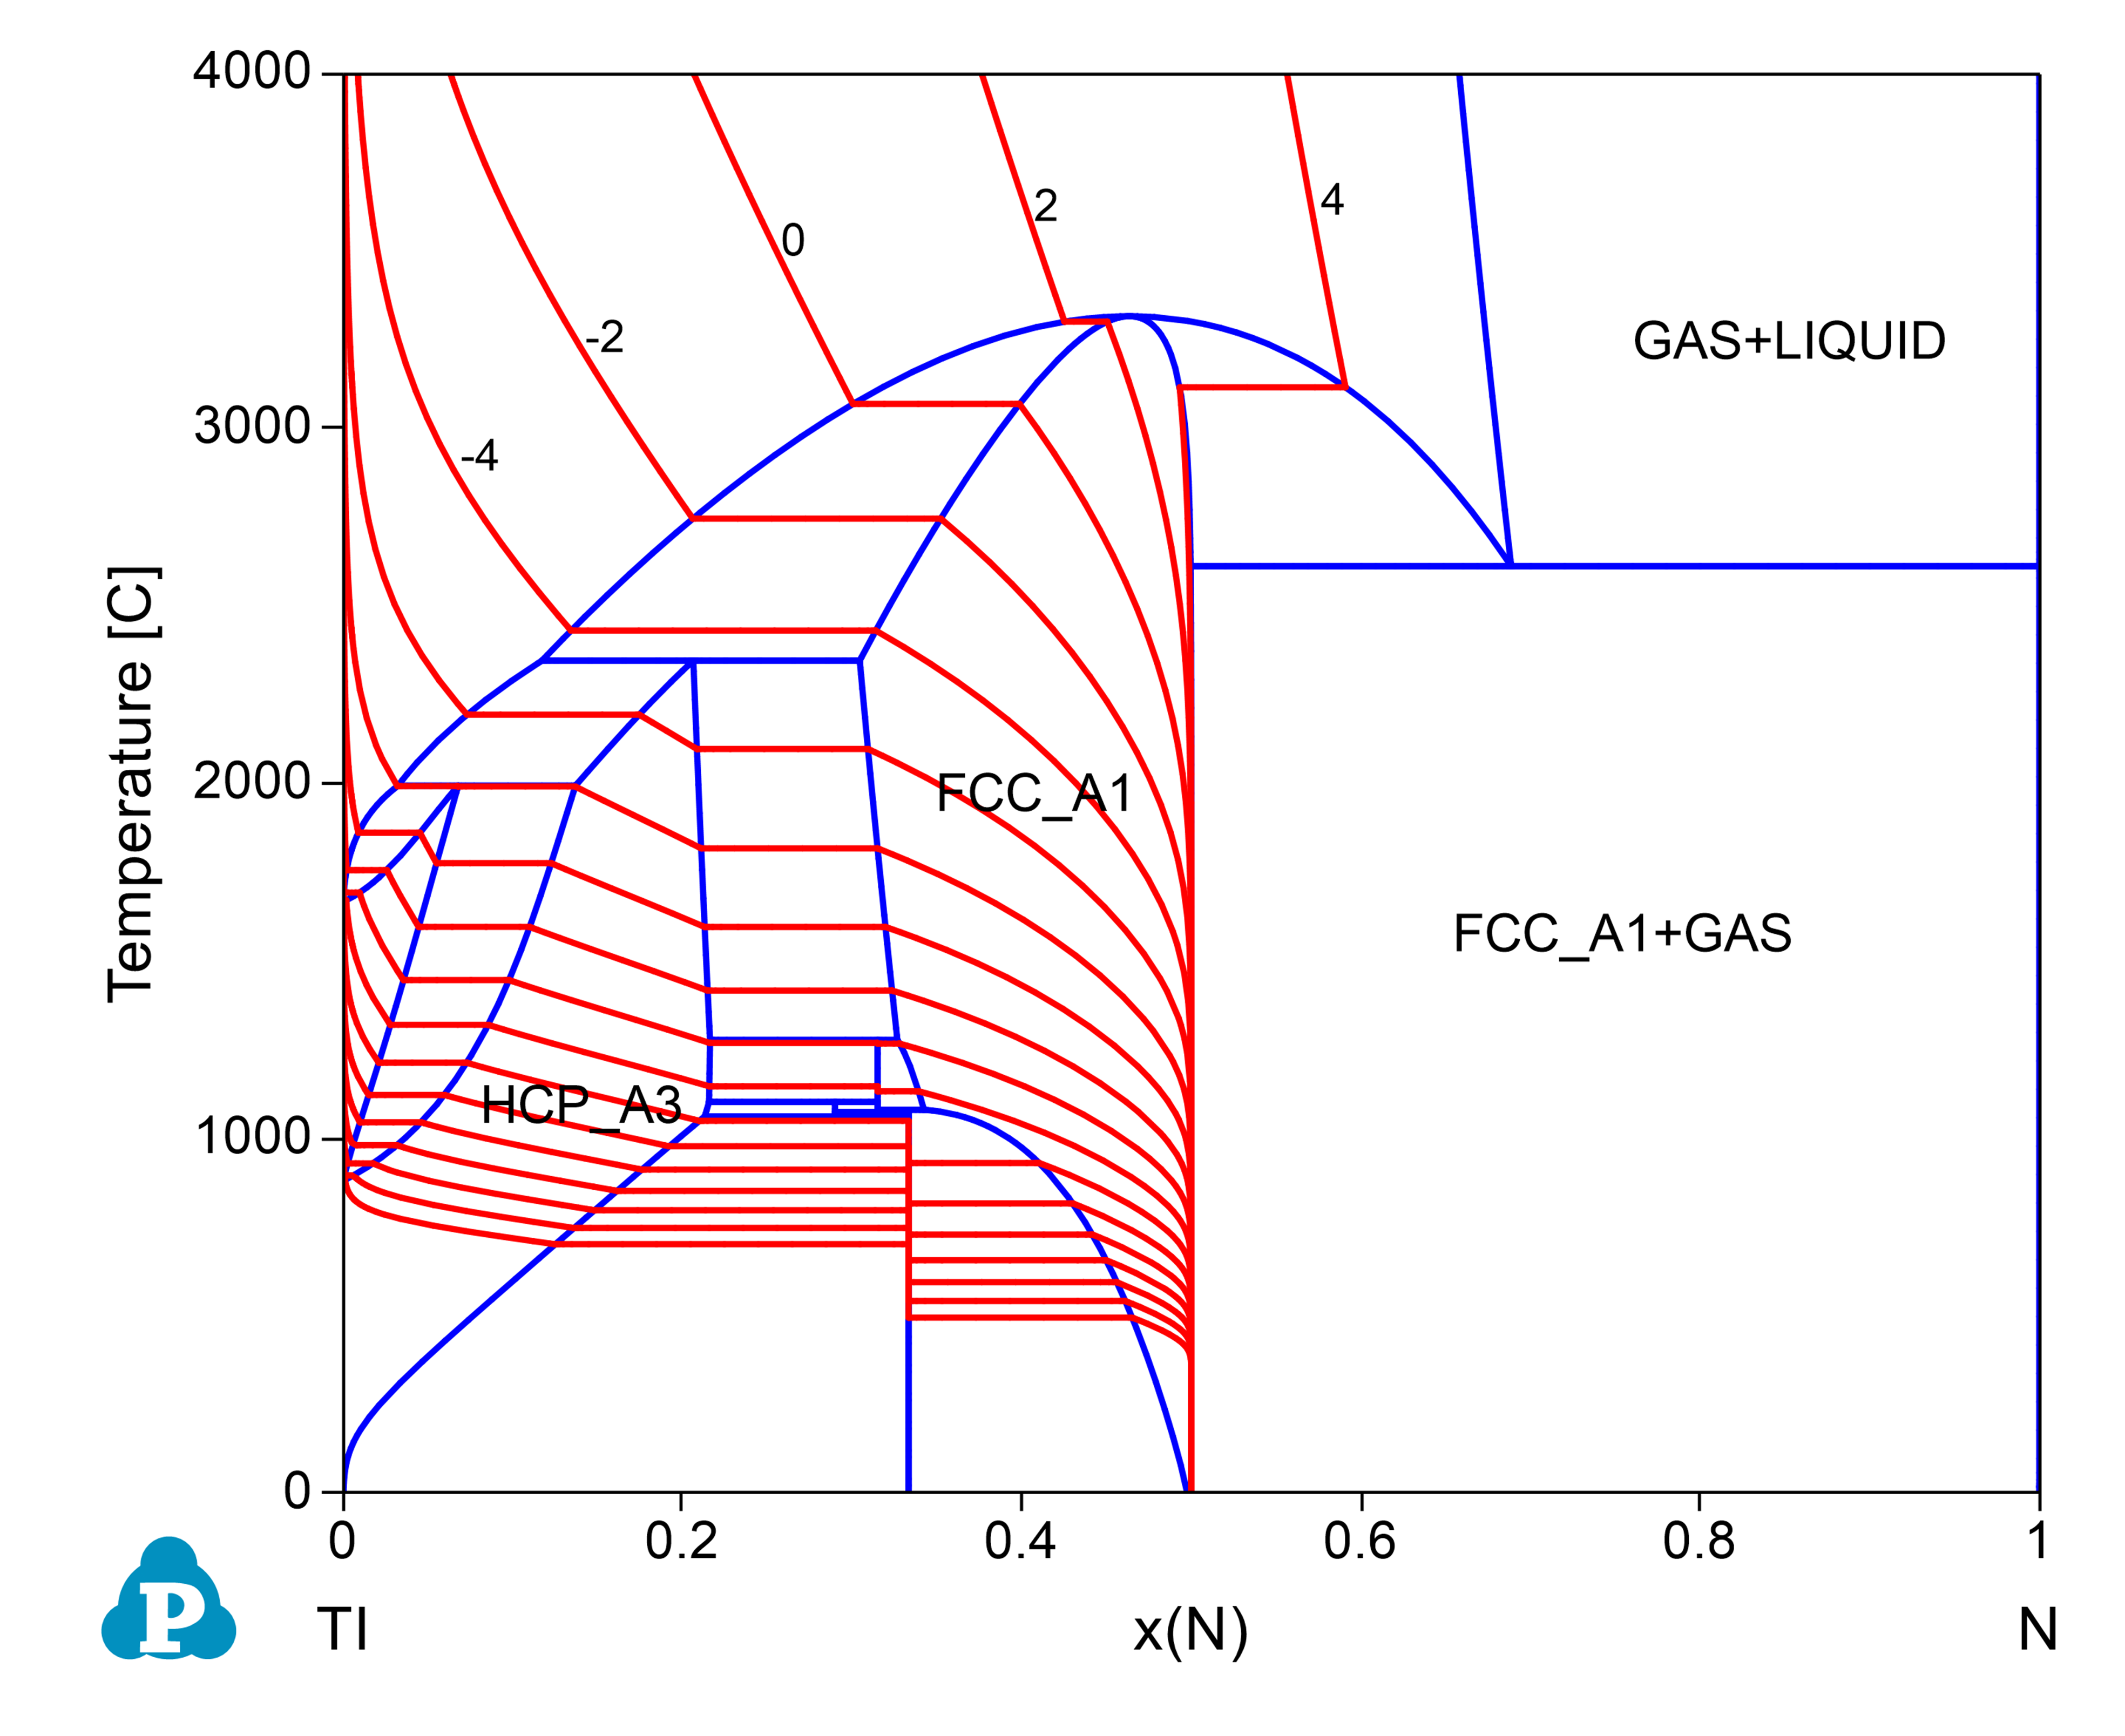
Figure 1.16.4: Calculated contour diagram of partial pressure of N2 in the Ti-N system