Example 1.15: Activity Contour Diagram
Purpose: Learn to calculate activity contour diagram. In this example, the activity contour lines of Mg will be calculated and plotted on the isothermal section of the Al-Mg-Zn ternary system at 500 °C.
Module: PanPhaseDiagram
Thermodynamic Database: Al_Demo.rtdb
Batch file: Example_#1.15.pbfx
Calculation Procedures:
- Load Al_Demo.rtdb following the procedure in Pandat User’s Guide: Load Database, and select all three components;
- First set up the calculation condition as shown in Figure 1.15.1 in the same way as we did to calculate Al-Mg-Zn isotherm (see Example 1.6 Isotherm of Al-Mg-Zn at 500°C), then click “Contour Lines” to open the contour line dialog as shown in Figure 1.15.2;
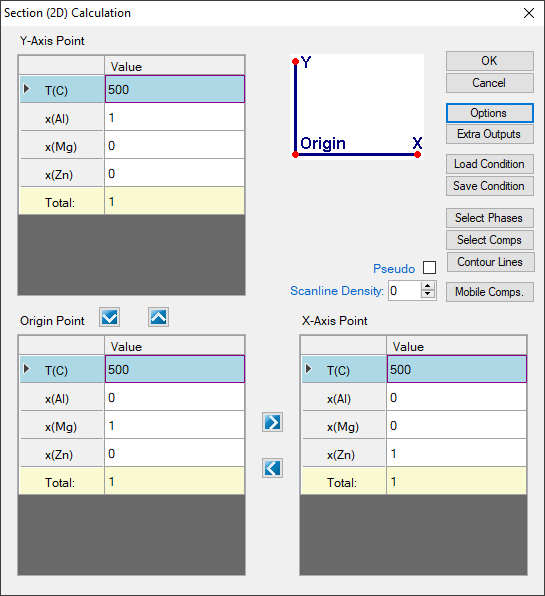
Figure 1.15.1: Setup calculation for an isotherm in the Al-Mg-Zn ternary at 500°C, then press “Contour Lines”
- Choose “User Custom Type” and click AddType in “a(Mg:Hcp)” for the Contour Type in the “Properties” window as shown in Figure 1.15.2, then press OK;
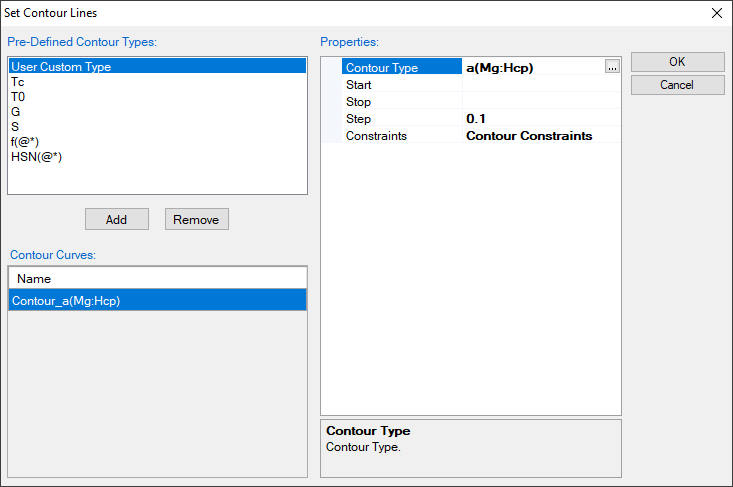
Figure 1.15.2: Type in “a(Mg:Hcp)” for the Contour Type in the “Properties” window, it is to calculate the activity of Mg contour lines using Hcp Mg as reference state
Post Calculation Operation:
- Change graph appearance following the procedure in Pandat User’s Guide: Property;
- Label each line by putting the cursor on each line and wait for the tool tip to pop out, then press F2;
Information obtained from this calculation:
- Figure 1.15.3 shows the activity contour diagram of Mg at 500 °C. The variation of Mg activity in the composition triangle is clearly seen at this temperature;
- Activity contour lines can also be plotted only in the selected phase field, such as in the Liquid phase field, in the Liquid+Fcc phase field. An example is given in Pandat User's Guide: Activity Contour Diagram;
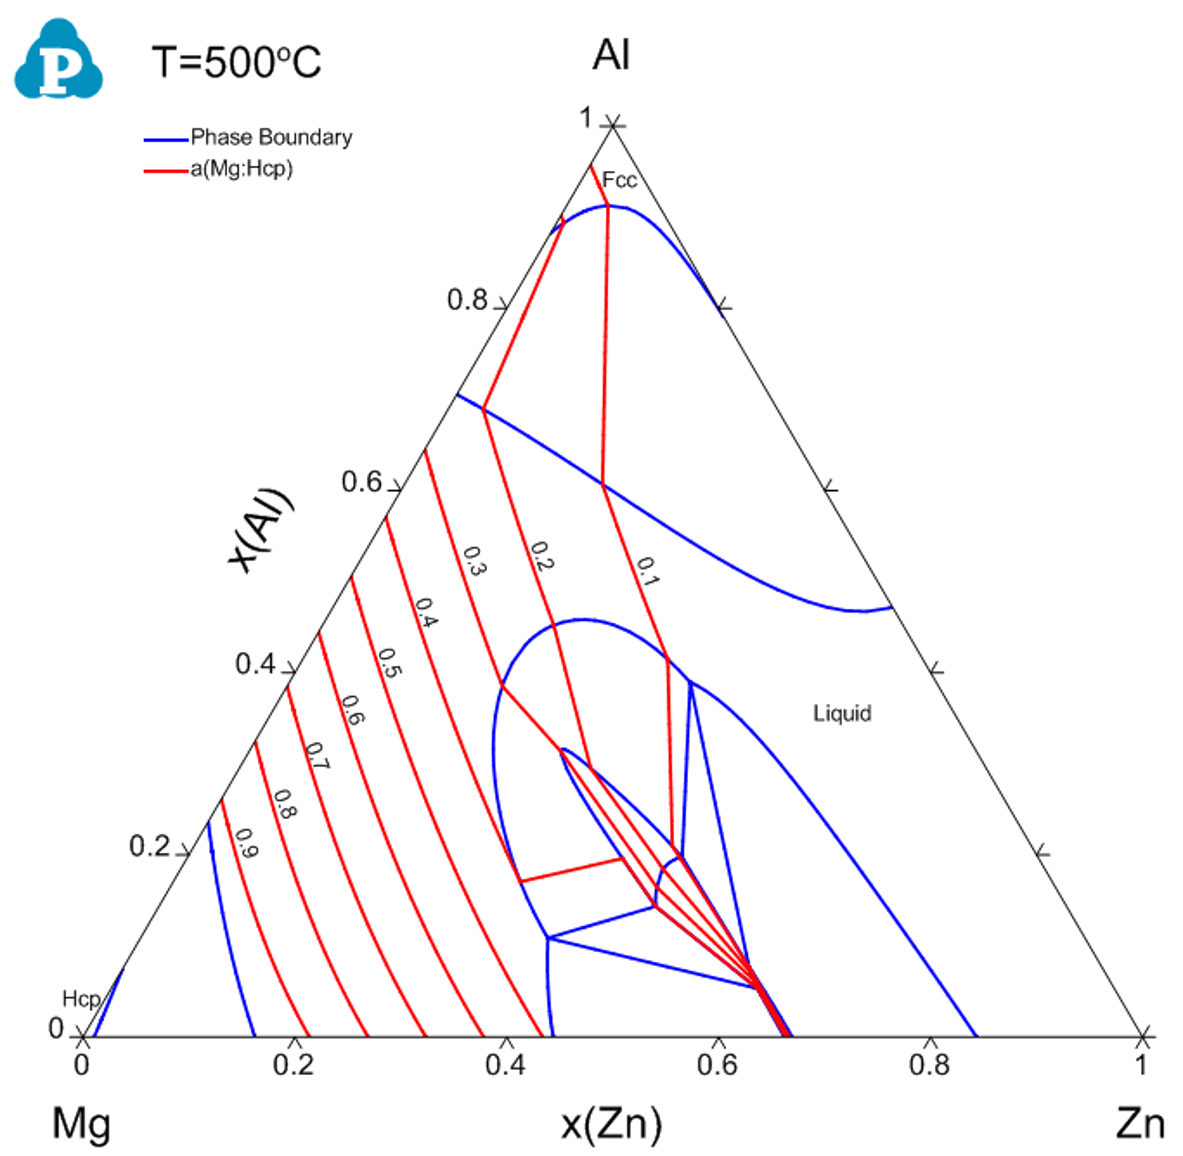
Figure 1.15.3: Activity contour diagram of Mg in the Al-Mg-Zn ternary at 500 °C