Example 1.2: Phase Fraction as a Function of Composition
Purpose: Learn to calculate and use a phase fractions vs. composition plot
Module: PanPhaseDiagram
Thermodynamic Database: Al_Demo.rtdb
Batch file: Example_#1.2.pbfx
Figure 1.2.1 is the Al-Mg binary phase diagram, which clearly shows the single phase region, two-phase region, three-phase equilibrium. However if you want to know the fraction of a stable phase in a two-phase field at a certain temperature, you need to draw a horizontal line at this temperature and calculate it by line (1D) calculation. In this example, we calculate the fraction of each phase as a function of composition, x(Mg), at 300°C (the red dash line).
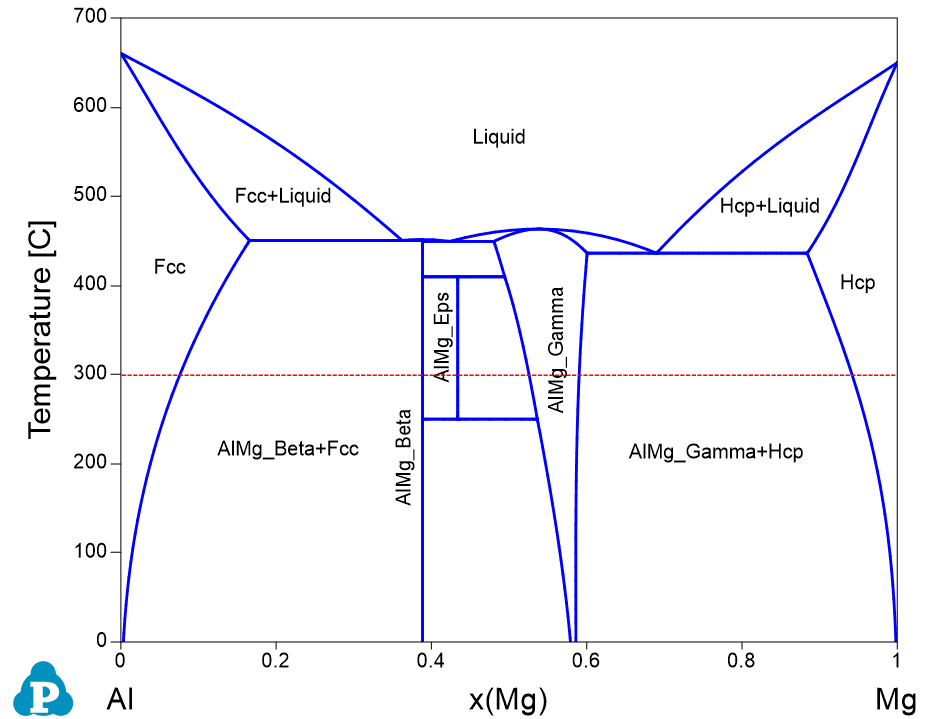
Figure 1.2.1: Al-Mg binary phase diagram
Calculation Procedures:
- Load Al_Demo.rtdb following the procedure in Pandat User’s Guide: Load Database, and select Al and Mg two components;
- Perform 1D calculation following the procedure in Pandat User’s Guide: Line Calculation (1D);
- Set Calculation Condition as shown in Figure 1.2.2;
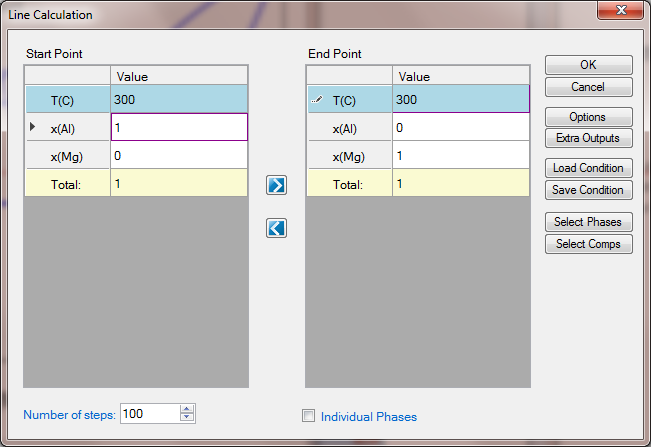
Figure 1.2.2: 1D calculation from pure Al to pure Mg at 300 °C
Post Calculation Operation:
- Add legend for graph following the procedure in Pandat User’s Guide: Icons for Graph on Toolbar;
- Change graph appearance following the procedure in Pandat User’s Guide: Property;
Information obtained from this calculation:
- The composition range that a phase is stable at the selected temperature;
- In a single phase field, the fraction of the stable phase is 1;
- In a two-phase field, the fraction of one phase decrease from 1 to 0, while the other increase from 0 to 1 as shown in Figure 1.2.3;
- Details on the fraction of each phase as a function of composition can also be found in the Default table as shown in Figure 1.2.4;
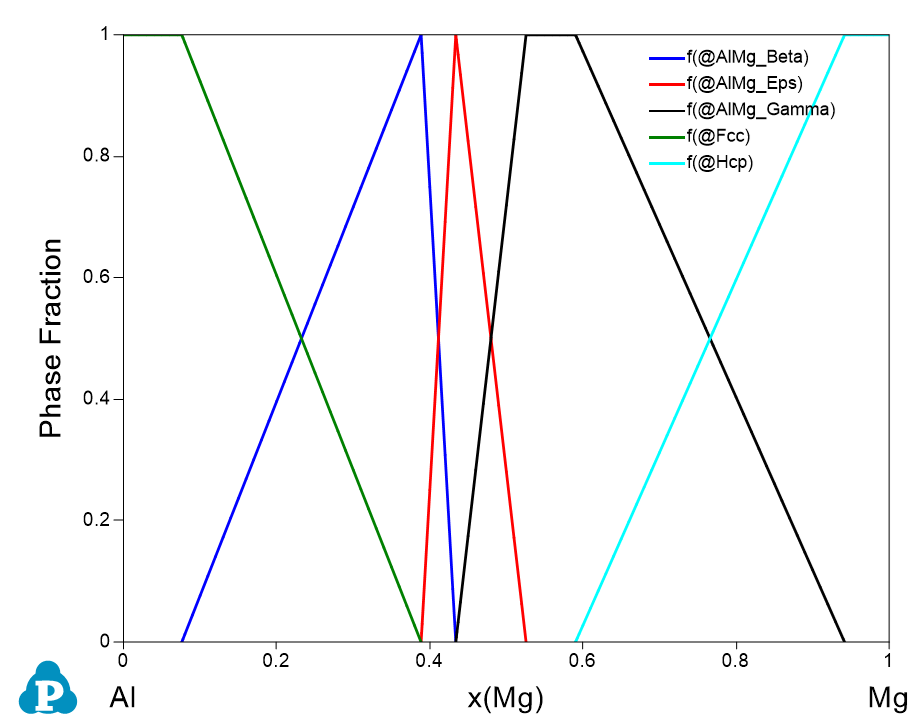
Figure 1.2.3: Phase fraction variation as a function of composition
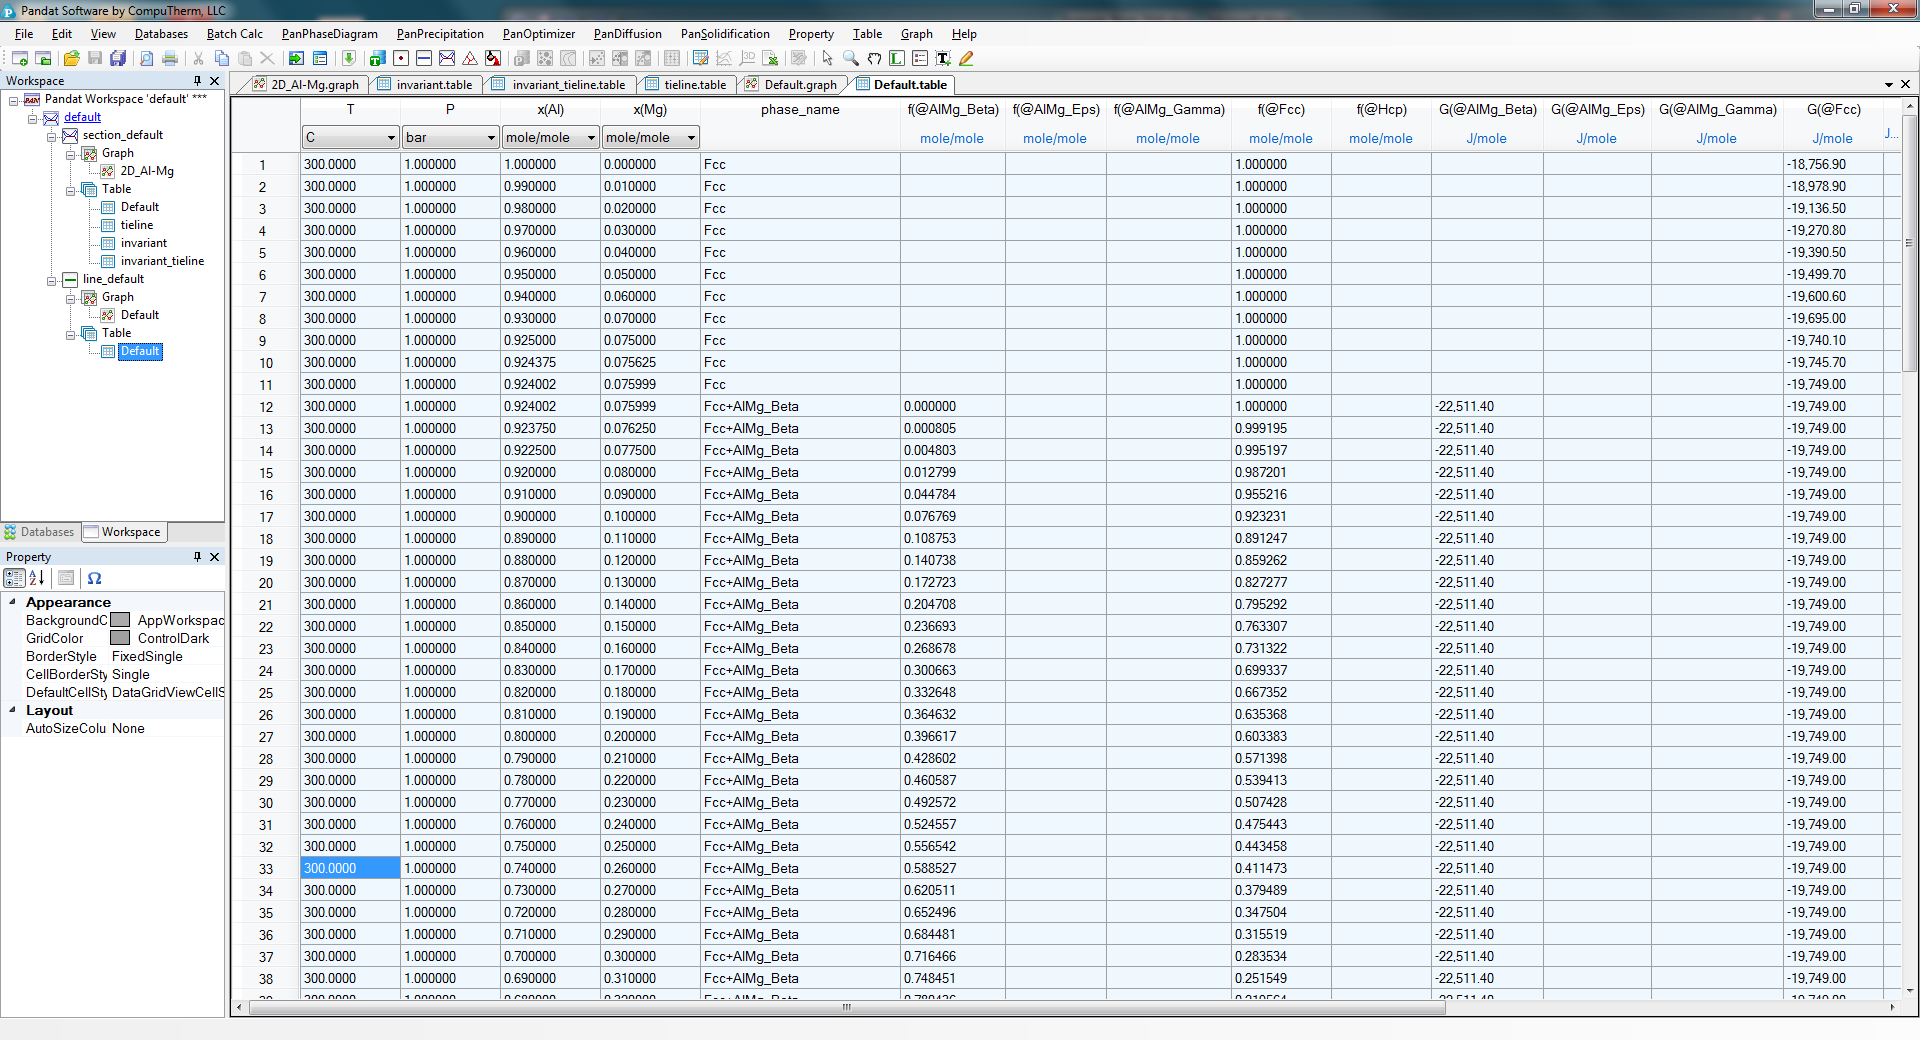
Figure 1.2.4: Default table showing phase fraction variation as a function of composition