Example 1.3: Phase Fraction as a Function of Temperature
Purpose: Learn to calculate and use a phase fractions vs. temperature plot
Module: PanPhaseDiagram
Thermodynamic Database: Al_Demo.rtdb
Batch file: Example_#1.3.pbfx
In Example 1.2, we have calculated the fraction of each phase as a function of composition. In most cases, people would like to know phase transformation when temperature varies. In this case example, we calculate the fraction of phases as a function of temperature for an AlMg binary alloy with composition of x(Mg)=0.3 (the red dash line in Figure 1.3.1). Such a calculation is especially valuable for a multi-component alloy.
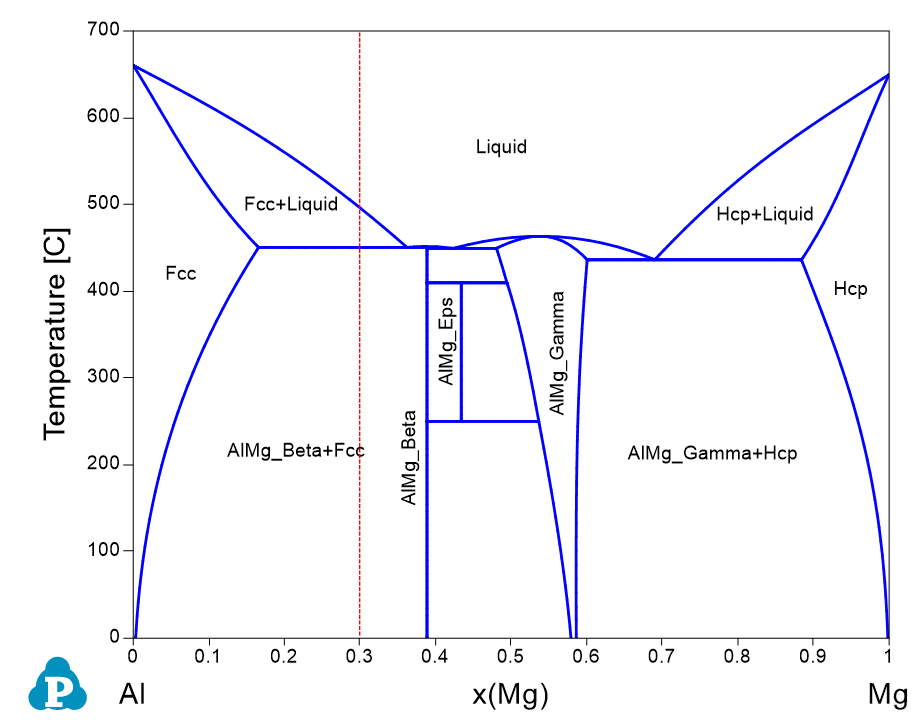
Figure 1.3.1: Al-Mg binary phase diagram
Calculation Procedures:
- Load Al_Demo.rtdb following the procedure in Pandat User’s Guide: Load Database, and select Al and Mg two components;
- Perform 1D calculation following the procedure in Pandat User’s Guide: Line Calculation (1D);
- Set Calculation Condition as shown in Figure 1.3.2;
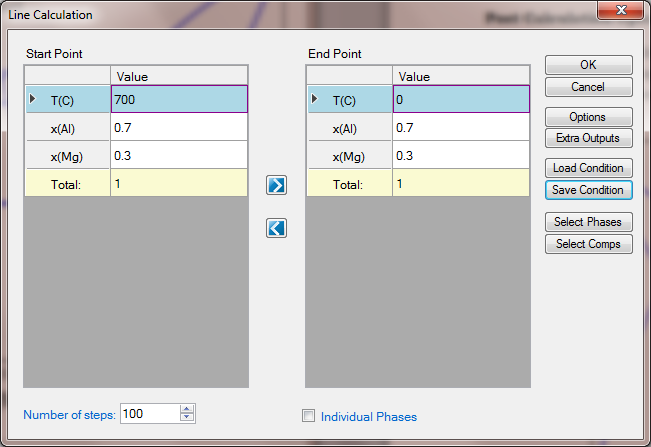
Figure 1.3.2: 1D calculation from 700°C to 0°C for an Al-Mg alloy with x(Mg)=0.3
Post Calculation Operation:
- Add legend for graph following the procedure in Pandat User’s Guide: Icons for Graph on Toolbar;
- Change graph appearance following the procedure in