Example 1.30: Thermal Conductivity Property Calculation
Purpose: Learn to calculate the thermal conductivity property.
Module: PanPhaseDiagram
Database: Al_Demo.rtdb
Batch files: Example_# 1.30a.pbfx (As Cast);Example_# 1.30b.pbfx (Quench);Example_# 1.30c.pbfx (Equilibrium)
Note: Pandat provides three models for thermal conductivity calculations depending on the treatment processes: As Cast (Scheil), Equilibrium (Lever), and Quench.
Calculation Procedures:
- Load Al_Demo.rtdb following the procedure in Pandat User’s Guide: Load Database, and select Al, Mg, Zn three components.
- Choose “Property 🡪 Solidification Property” from the menu, set alloy composition as Mg-9Al-1Zn(wt.%), select As Cast (Scheil) model as shown in Figure 1.30.1. In the “Choose Target Properties for Plot” window, choose “Sys_ThCond”, then click OK.
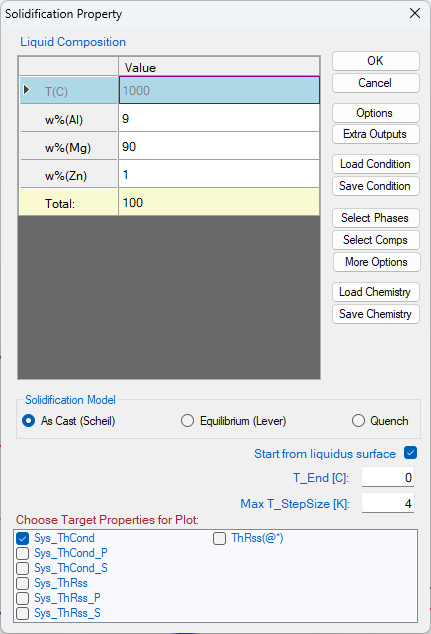
Figure 1.30.1: Setting conditions in the Solidification Property window
- The calculated thermal conductivity is shown in Figure 1.30.2. User can also plot experimental data from the literatures for comparison (refer to Example 1.26 to add experimental data on the plot).
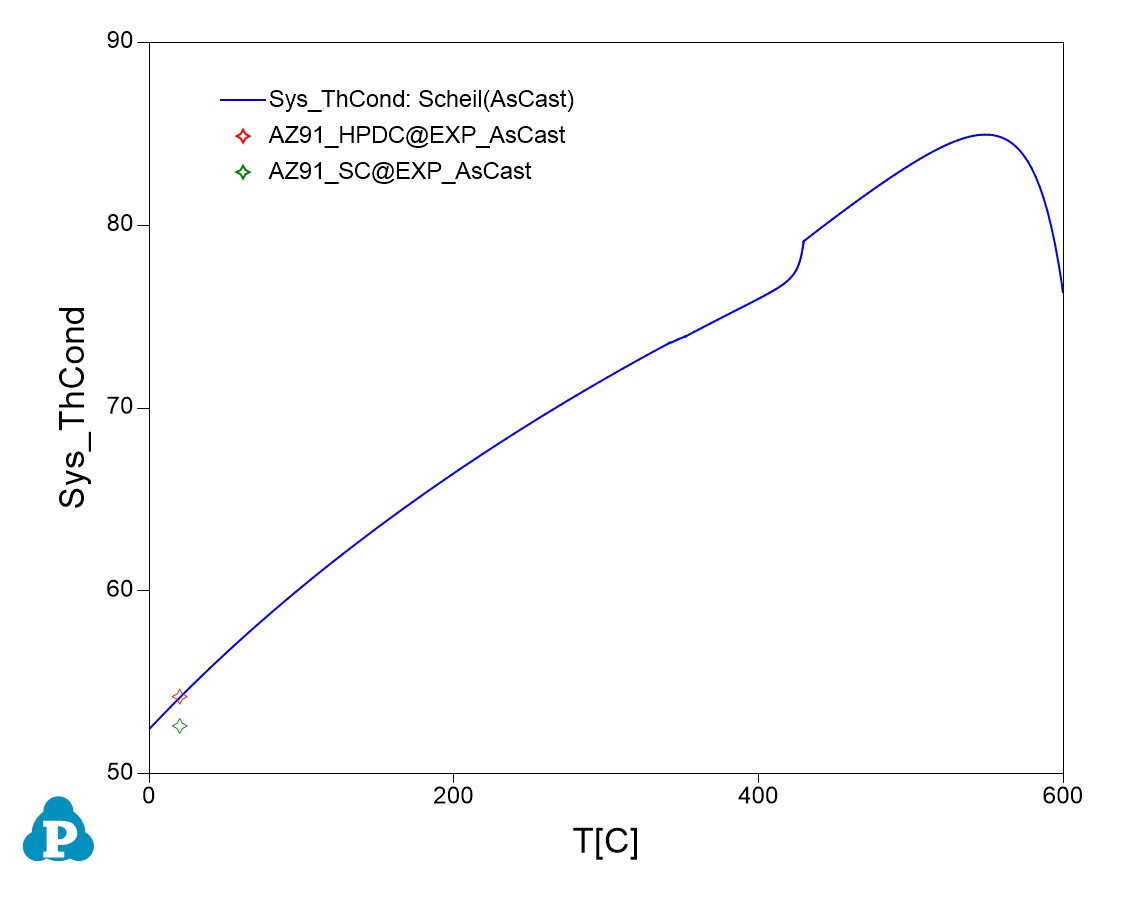
Figure 1.30.2: Calculated thermal conductivity using the As Cast (Scheil) model compared with the experimental as-cast data
- Perform another calculation using the Quench model. Set the calculation condition as shown in Figure 1.30.3, i.e., select the Quench model and set the quench temperature as 415 °C.
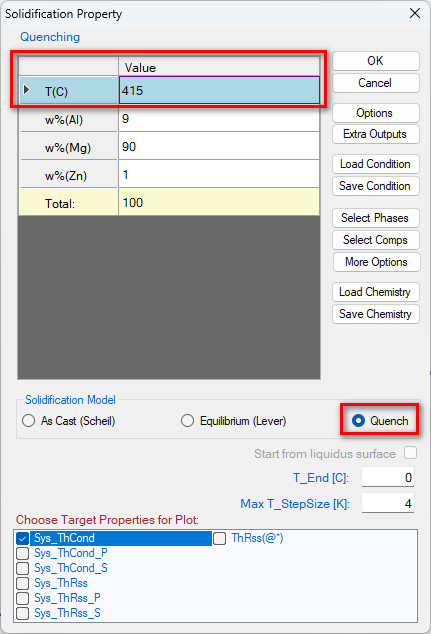
Figure 1.30.3: Setting calculation conditions using the Quench model
- The calculated thermal conductivity with Quench model is shown in Figure 1.30.4. Experimental data from literatures for T4 solid-solution–treated samples quenched from 415 °C are also plotted in the figure for comparison.
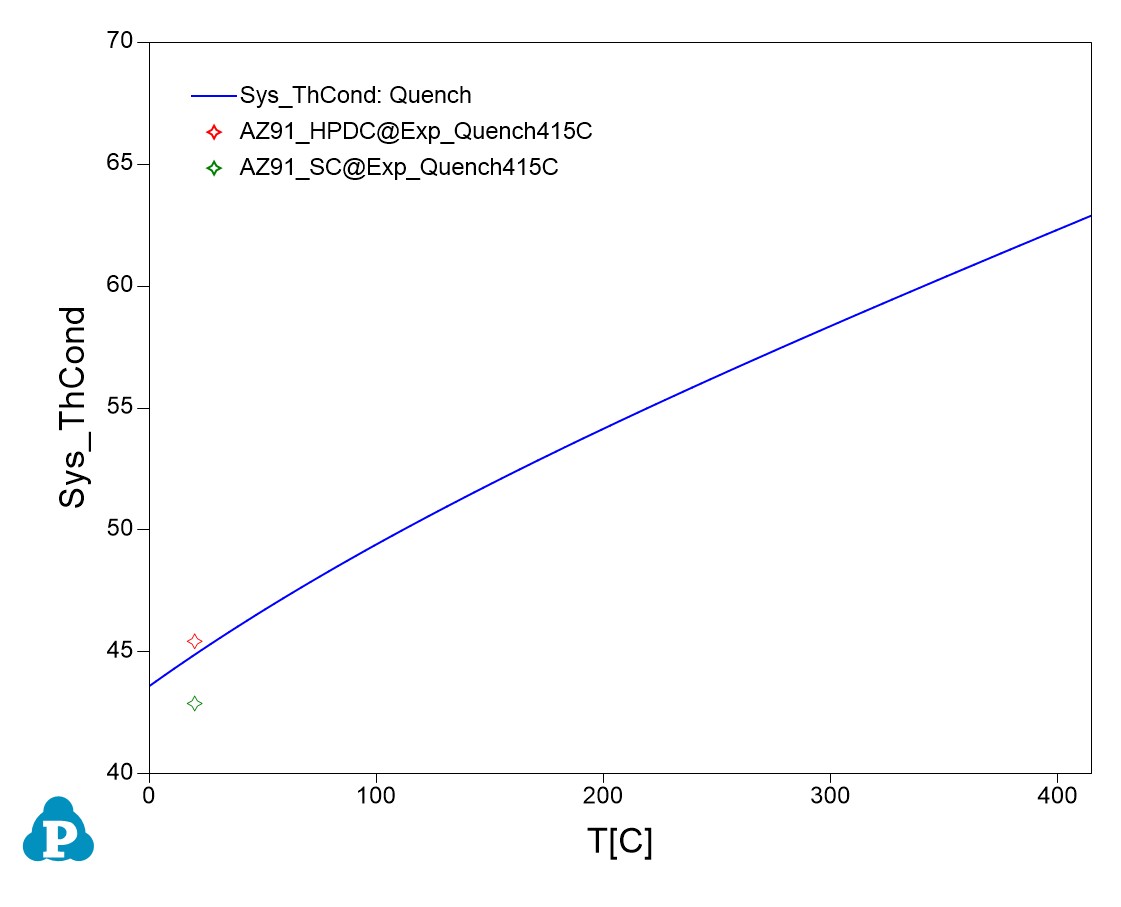
Figure 1.30.4: Calculated thermal conductivity using the Quench model compared with the experimental data.
- Perform another calculation using the Equilibrium model. By following the same procedure as shown in Figure 1.30.1 and selecting the Equilibrium (Lever) model, thermal conductivity of an alloy can be calculated under equilibrium condition at different temperatures. Figure 1.30.5 presents the calculated thermal conductivity of AZ91 in the temperature range of 0-600oC. Under equilibrium conditions, the thermal conductivity decreases with increasing temperature up to the solidus temperature. This behavior is attributed to the increased solubility of alloying elements in the solid solution phase at higher temperatures, which reduces the thermal conductivity of the alloy.
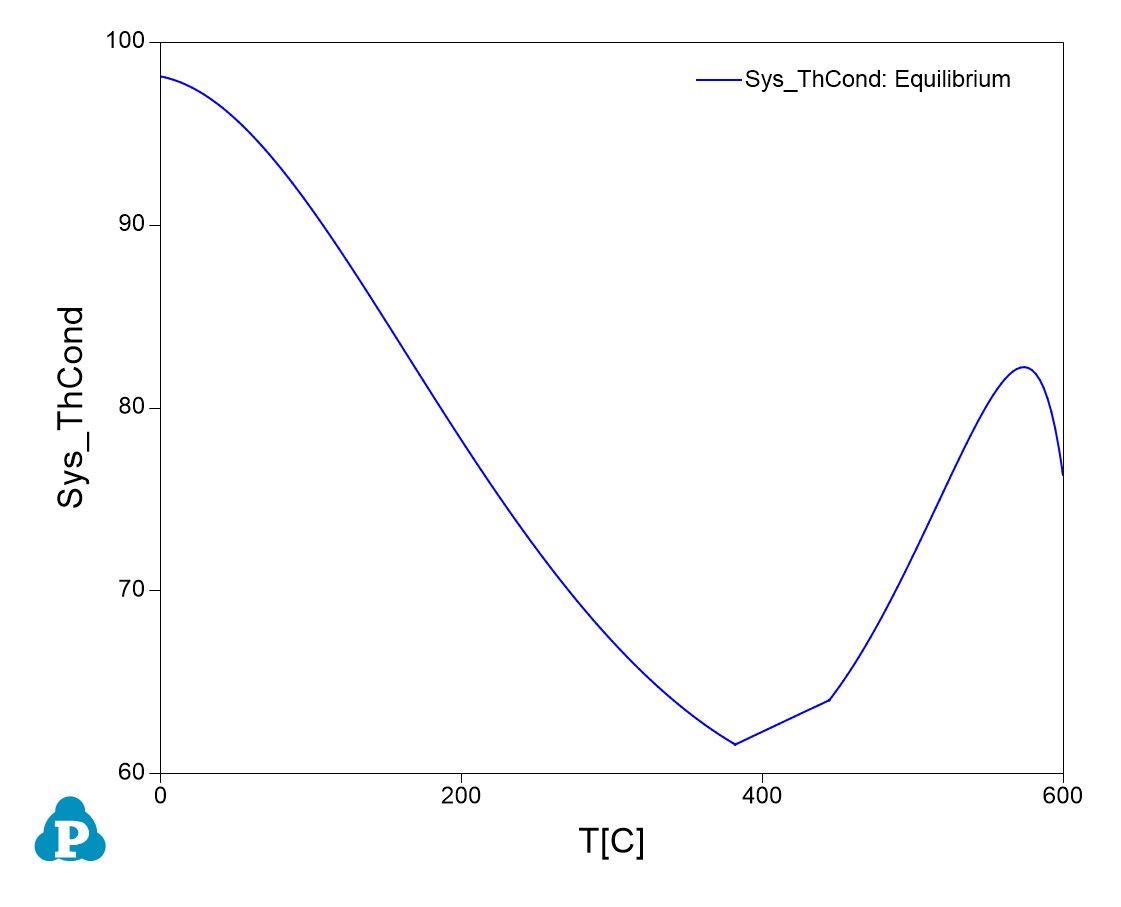
Figure 1.30.5: Calculated thermal conductivity using the Equilibrium (Lever) model
Information obtained from this calculation:
- Thermal conductivity of an alloy depends on not only the alloy composition, but also the treatment conditions.
- Three models are provided in Pandat. A proper model should be used in the calculation when understanding an alloy behavior or comparing with experimental data.