Example 1.28: Calculation of T0 curve
Purpose: Learn to calculate the T0 curve between two phases.
Module: PanPhaseDiagram
Thermodynamic Database: Al_Demo.rtdb
Batch file: Example_#1.28.pbfx
Background: T0 curve is the trace of a series of points in a two-phase field at which the Gibbs energy of the two phases are identical. It is the limit of partitionless phase transition, such as martensite transformation. In this example, we will learn how to calculate the T0 curve between two solution phases. The T0 curves between Hcp/Liquid and Fcc/Liquid are used as example in this case.
Calculation Procedures:
- Load Al_Demo.rtdb following the procedure in Pandat User’s Guide: Load Database, and select Al, Mg elements;
- Perform section (2D) calculation following the procedure in Pandat User's Guide: Section Calculation (2D);
- Set the calculation condition as shown in Figure 1.28.1; This is a normal setting for phase diagram calculation as shown in Example 1.1;
- The Contour Lines function is used to calculate the T0 curve, click the “Contour Lines” icon, the “Set Contour Lines” window pop up as shown in Figure 1.28.2. Add the T0 as the Contour Curves, select “Phase Name” as “Liquid”, and the “Phase Name #2” as “ * ”, Pandat will calculate the T0 curve between liquid and all solid solution phases. In this example, they are Fcc in Al side, and Hcp in Mg side .
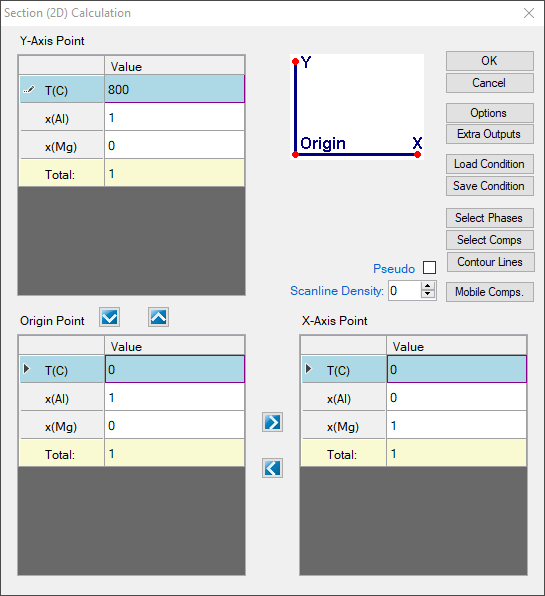
Figure 1.28.1: 2D calculation with composition from pure Al to pure Mg and temperature from 0°C to 800°C
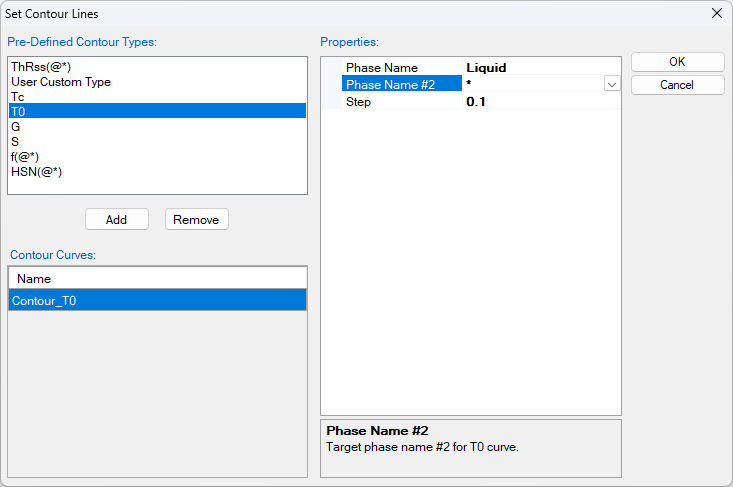
Figure 1.28.2: The Set Contour Lines window
Post Calculation Operation:
- Change graph appearance following the procedure in Pandat User’s Guide: Property;
- Label the graph following the procedure in Pandat User’s Guide: Icons for Graph on Toolbar;
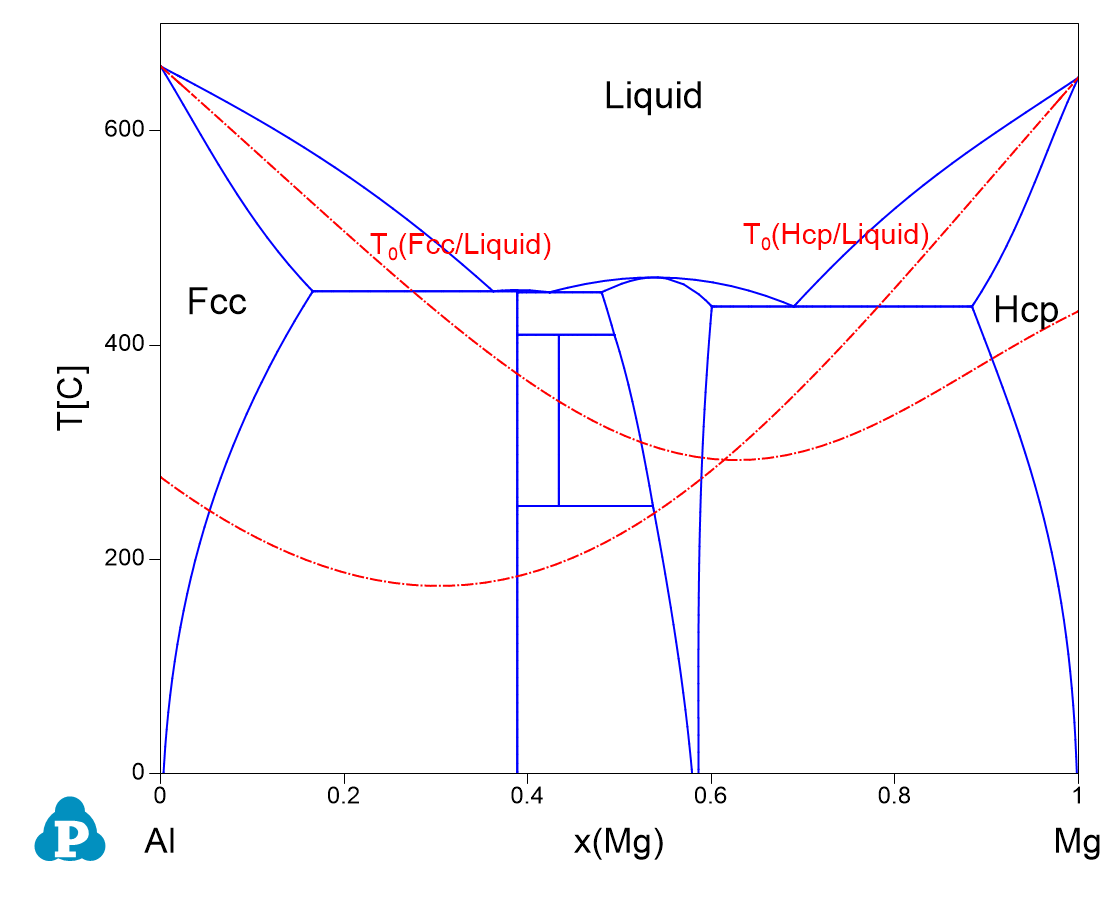
Figure 1.28.3: The calculated Al-Mg phase diagram together with T0 curves of Fcc/Liquid and Hcp/Liquid
Information obtained from this calculation:
- The T0 curves in Al-Mg system between Fcc/Liquid and Hcp/liquid are obtained.