Diffusion among Multiple Regions
- Purpose: Learn to perform diffusion simulation at constant temperature for a diffusion sandwich with different phase structure but uniform composition through each region before diffusion;
- Module: PanDiffusion
- Database: FeCrNi.tdb
Calculation Method 1:
- From menu bar click Batch Calc-> Batch Run, select Example_#4.5.pbfx;
Calculation Method 2:
- Create a workspace and select the PanDiffusion module following Pandat User’s Guide 2.1;
- Load FeCrNi.tdb following the procedure in Pandat User’s Guide 3.2.1;
- Click on “PanDiffusion->Diffusion Simulation” and set up the calculation condition as shown in Figure 1. First click the blue “+” above Regions to add another region, Region_3. Select Region Composition Distribution as “Uniform”.
- Click on Region_1 and set the composition of the left region of the diffusion triple as 30Cr-10Fe-60Ni (at%). Select Fcc as the entered phase in “Select Phases” of “Settings for the Selected Region [Region_1]”.
- Click on Region_2 and set the composition of the middle region of the diffusion triple as 55Cr-40Fe-5Ni (at%), Select Bcc as the entered phase in “Select Phases” of “Settings for the Selected Region [Region_2]”.
- Click on Region_3 and set the composition of the right region of the diffusion triple as 10Cr-20Fe-70Ni (at%). Select Fcc as the entered phase in “Select Phases” of “Settings for the Selected Region [Region_3]”.
- The length of each region is set to be 100 um, and the number of grids (# of Grids) is the default value of 100.
- The Thermal History is holding the diffusion sandwich at 1000oC for 500 hours.
- In the setting shown in Figure 36.1, composition profiles at the initial and final stages, as well as that at 200 hour will be outputted. Click OK to perform calculations.
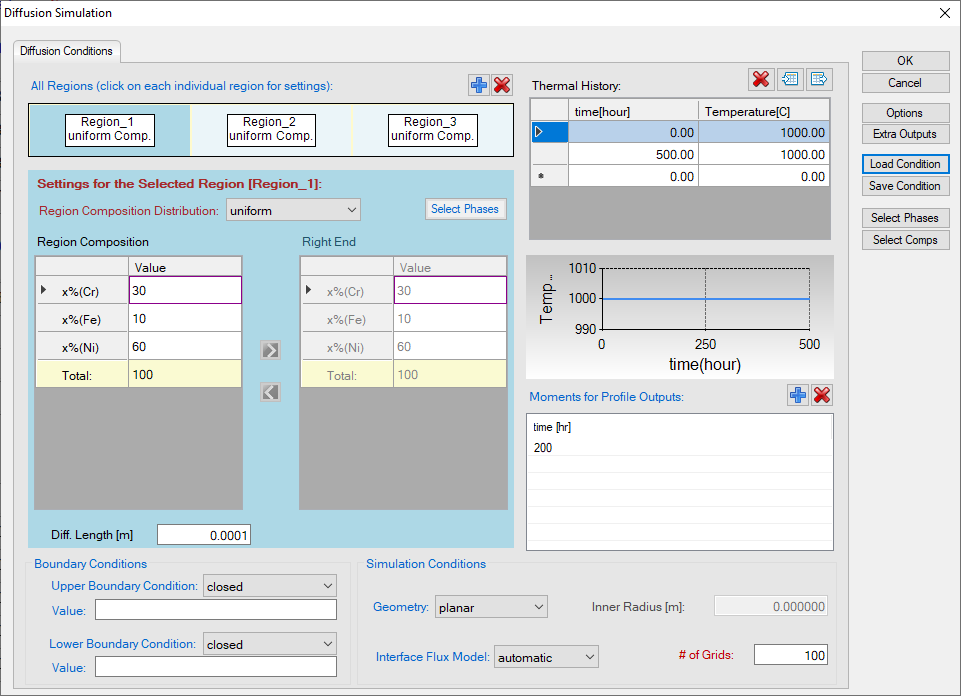
Figure 1. Setting of the simulation condition
Post Calculation Operation:
- The calculated plot is shown in Figure 2. Add text and change graph appearance following the procedure in Pandat User’s Guide 2.3.1;
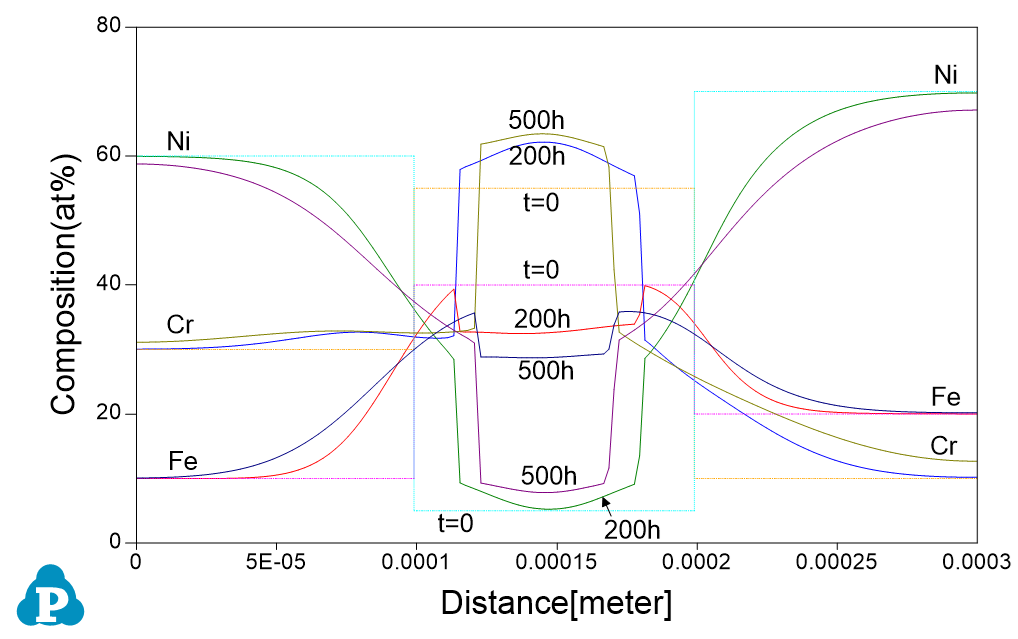
Figure 2. Calculated composition profiles for the diffusion sandwich at 1000oC for 200h and 500h
Information obtained from this calculation:
- The three regions of the diffusion triple locate at different phase fields, the one in Bcc is sandwiched between two regions in the Fcc as shown in Figure 3;
- After holding the diffusion couple at 1000oC for 500 hours, composition profiles can be viewed at final stage (500h) and intermediate stage (200h). The phase boundaries are moved;
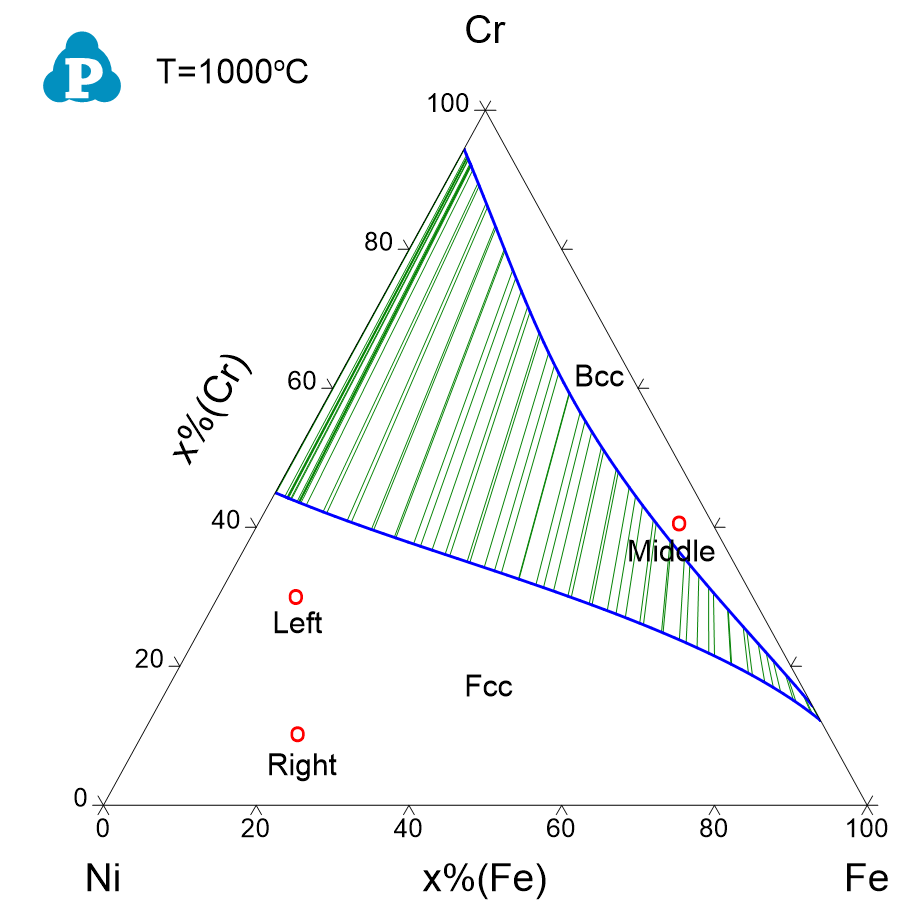
Figure 3. Isothermal section of Ni-Cr-Fe at 1000oC, the initial compositions of the left and right regions locate in the single Fcc phase field, while the middle region locates in the Bcc phase field