Friction-stir welding between AA5454 Al alloy and AZ91 Mg alloy
- Purpose: Learn to perform complicated multi-component vertical section calculations and understand the application of zero phase fraction (ZPF) line of the liquid phase. Commercial Mg database is required to perform the calculation of this example.
- Module: PanPhaseDiagram
- Database: PanMg2020.pdb
- Background: Due to the formation of brittle intermetallic phases in the fusion zone, joining Mg alloys with Al alloys through fusion welding is not very suitable. Friction stir welding (FSW) provides a potential method for joining Mg alloys and Al alloys. In this example, an AZ91 cast Mg alloy and rolled AA5454 Al alloy are assumed to be jointed through FSW. A vertical section from the composition of AZ91 to AA5454 shows the possible intermetallic phases could be formed in the welding interface. In addition, the zero phase fraction line of the liquid phase indicates the maximum temperature that can be tolerated during the welding process to avoid the melting zone in the interface.
Calculation Method:
- Create a workspace and select the PanPhaseDiagram module following Pandat User’s Guide 2.1;
- Load PanMg2020.pdb following the procedure in Pandat User’s Guide 3.2.1, and select the elements: Al, Fe, Mg, Mn, Zn.
- Perform 2D calculation. (Also detailed described in Pandat User’s Guide 3.3.3)
- Set Calculation Condition as shown in Figure 1: Composition from AA5454: Al-3Mg-1Mn-0.3Fe-0.01Zn(wt.%) at left edge to AZ91: Mg-8.2Al-1Zn-0.2Mn-0.01Fe (wt.%) at right edge; Temperature range from 300 °C to 500 °C;
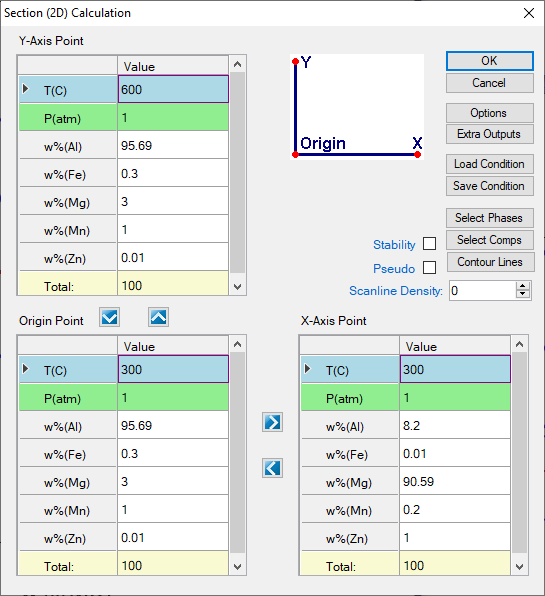
Figure 1. Set vertical section calculation conditions
- As this is a complicated phase diagram calculation, option “extensive search” is recommended. Click options in the interface shown in Figure 1, an interface as shown in Figure 2 will pop-up. Select “Extensive Search” in the “PanEngine Settings”. Then click OK. (Detailed description on “Extensive Search” can be found in Pandat User’s Guide 3.2.2). Note that “extensive search” may not be necessary for most calculations, yet, it provides users with an option for the calculation of complicated diagrams.
- In Figure 2. Click “Contour line” in the interface shown Figure 1, The “Set Contour Lines” interface pop-up as shown in Figure 3, select the “f(@*)” from the Pre-Defined Contour Types, “f(@*)” means the fraction of certain phase, then select “Liquid” to replace the “*” to define the fraction of liquid phase. Start value and Stop value are set as “0”, and Step value set as “1”. Then click OK.
- The interface goes back to Figure 1, click OK to start calculation
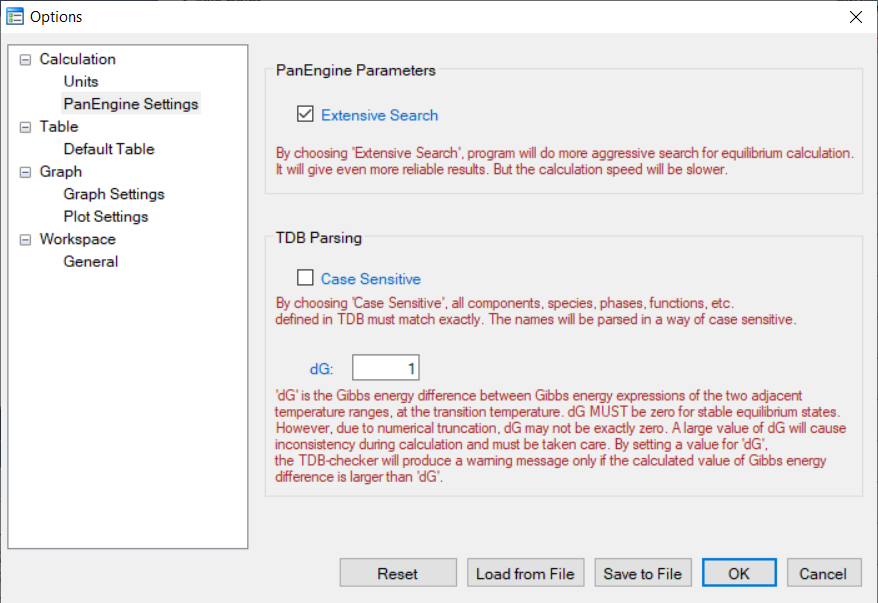
Figure 2. Set “Contour line” calculations to highlight the ZPF line of the liquid phase.
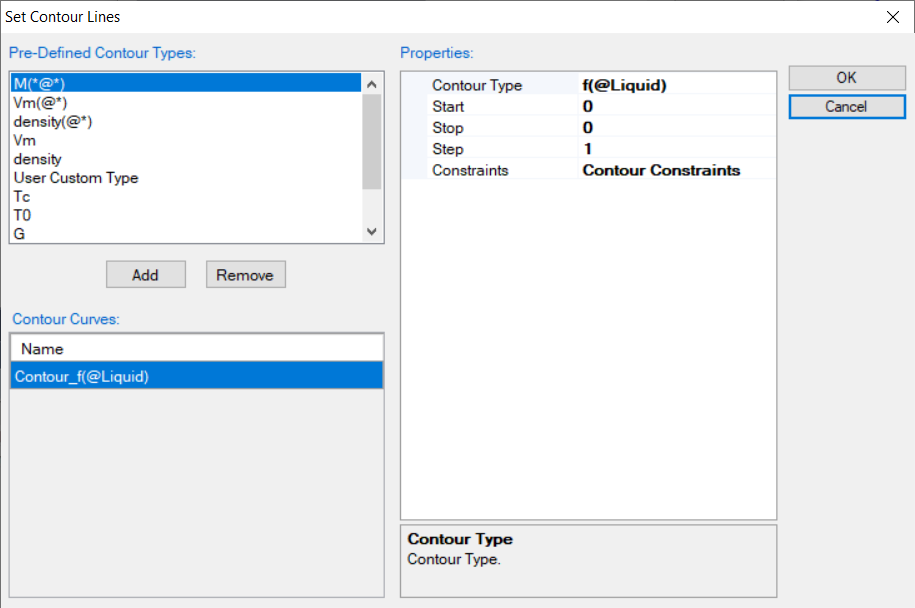
Figure 3. Contour line setting for the ZPF line of the liquid phase
Post Calculation Operation:
- The default calculated phase diagram is shown as Figure 4. The left edge corresponds to the composition of AA5454 (Al-3Mg-1Mn-0.3Fe-0.01Zn(wt.%)), and the right edge is the composition of AZ91 (Mg-8.2Al-1Zn-0.2Mn-0.01Fe (wt.%)). The highlighted red line is the ZPF line of the liquid phase, which represents the melting temperature at each composition. In other words, liquid phase will appear above the red line
- Change the scale and increment of the diagram. (Also detailed described in Pandat User’s Guide 2.3.1) The scale of the axes can be set through the Property window at the left side of the interface as shown in Figure 5. In this example, X axis is set from 0 to 90.59, increment value 10. Y axis is set from 300 to 600 with increment of 50.
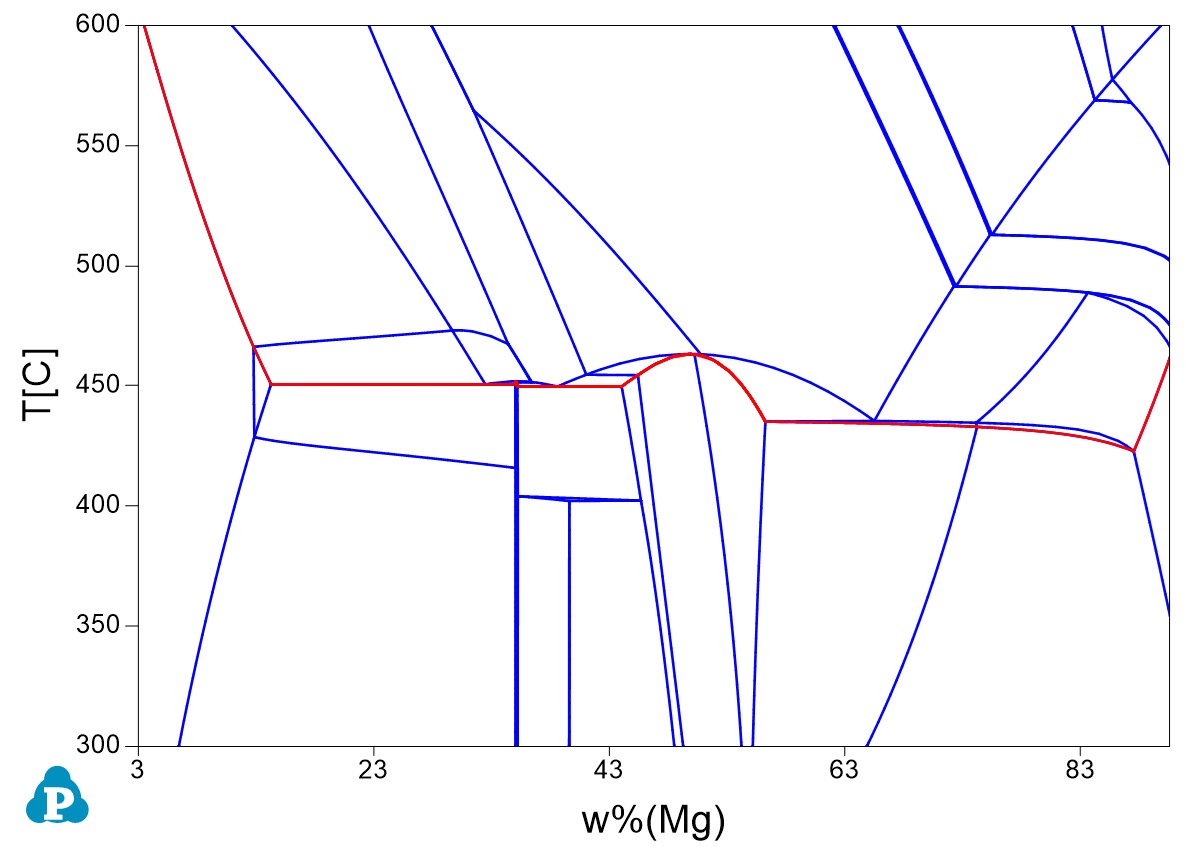
Figure 4. Default calculated phase diagram from AA5454 to AZ91.
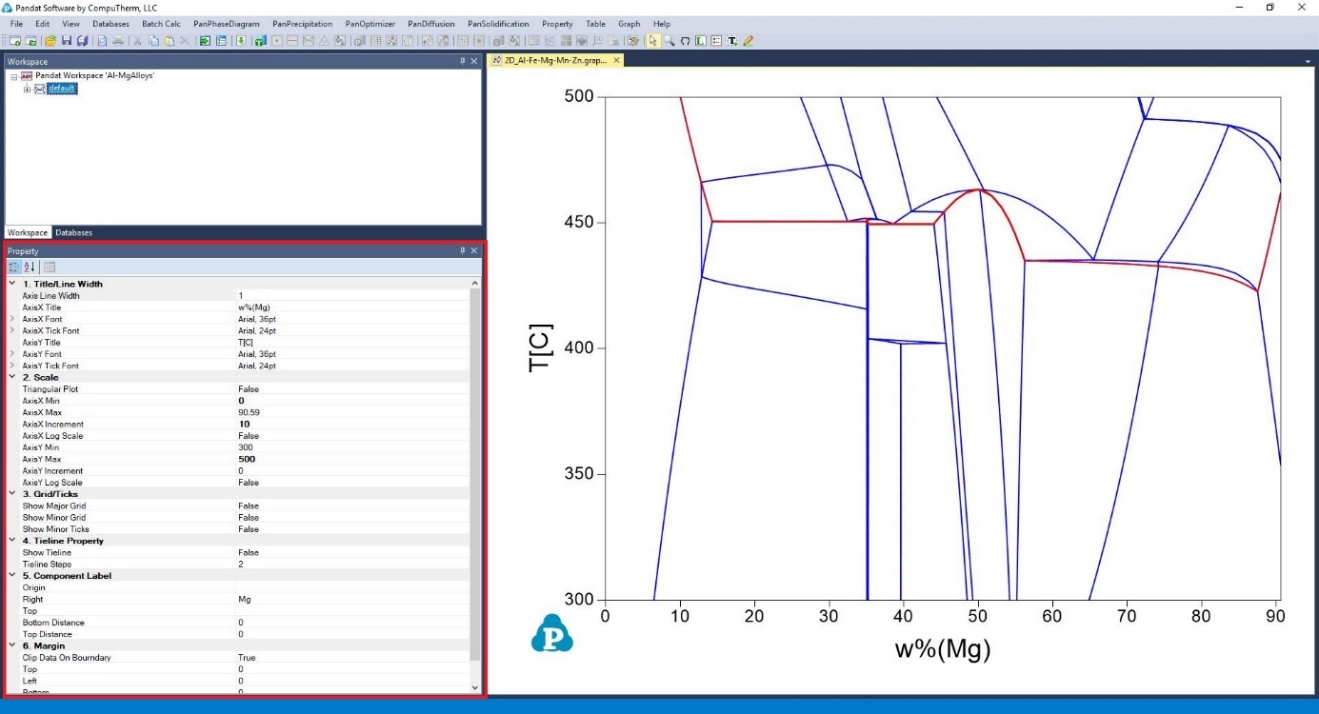
Figure 5. Graph property setting window to set axis scale, increment, title text.
- Label phase field (Also described in detail in Pandat User’s Guide 2.3.3);
- Click button
 , Pandat goes into Label function, then click the mouse on the diagram, the phase field at the location of the mouse will be labeled. If the user holds the <Ctrl> key first and then click the mouse on the diagram, the program will do a point calculation at the composition and temperature where the cursor locates. After added all phase field labels and put them in proper position, the final phase diagram is shown as Figure 6.
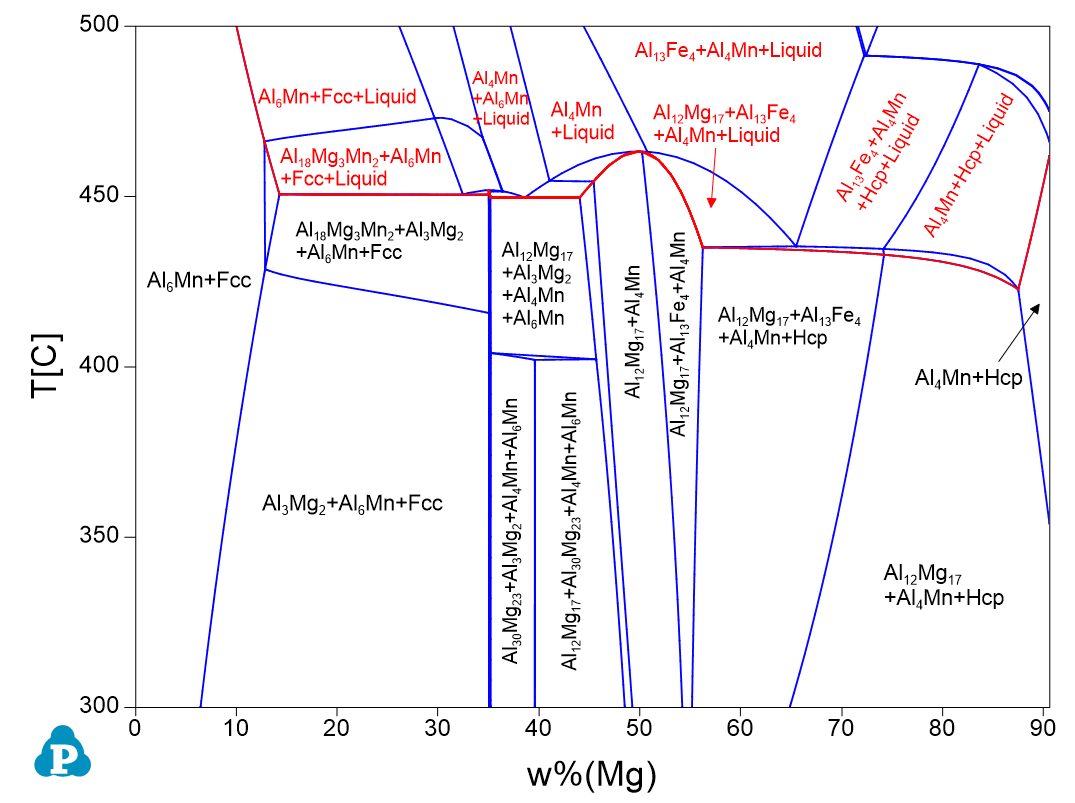
Figure 6. The vertical phase diagram from AA5454 to AZ91 with phase field labels. The phase fields including Liquid phase are labeled as red.
Information obtained from this calculation:
- The local temperatures in the welding zone during friction-stir welding process should be controlled to be lower than given by the red line to avoid partial melting. The lowest temperature in this case is 435.7 °C.
- Different intermetallic phases may form in the joining zone: The Al3Mg2 phase with some Al6Mn precipitate near the Al alloy side, and Mg17Al12 phase with minor precipitation of Al4Mn near the Mg alloy side.
- Similar approach can also be used to understand other reactions between different materials, for example coating/substrate reactions