Phase Fraction as a Function of Temperature
- Purpose: Learn to calculate and use a phase fractions vs. temperature diagram. This type of phase diagram is important in setting up a temperature window for heat treatment.
- Module: PanPhaseDiagram
- Database: AlMgZn.tdb
In this example, we have calculated the fraction of each phase as a function of composition. In most cases, people would like to know phase transformation when temperature varies. In this example, we calculate the fraction of phases as a function of temperature for an alloy with 70 at% Al and 30 at% Mg (the red dash line in right-hand figure). Such a calculation is especially valuable for a multi-component alloy.
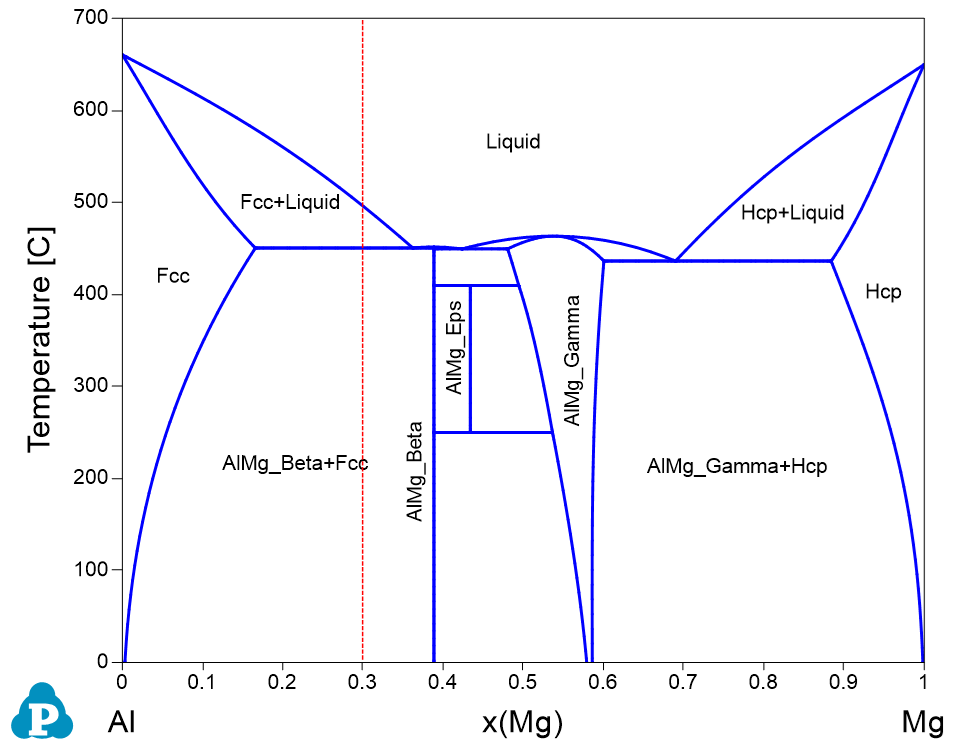
Al-Mg binary phase diagram
Calculation Method 1:
- From menu bar click Batch Calc-> Batch Run, select Example_#1.3.pbfx
Calculation Method 2:
- Load AlMgZn.tdb following the procedure in Pandat User’s Guide 3.2.1;
- Perform 1D calculation following the procedure in Pandat User’s Guide 3.3.2;
- Set Calculation Condition as shown in the right-hand figure;
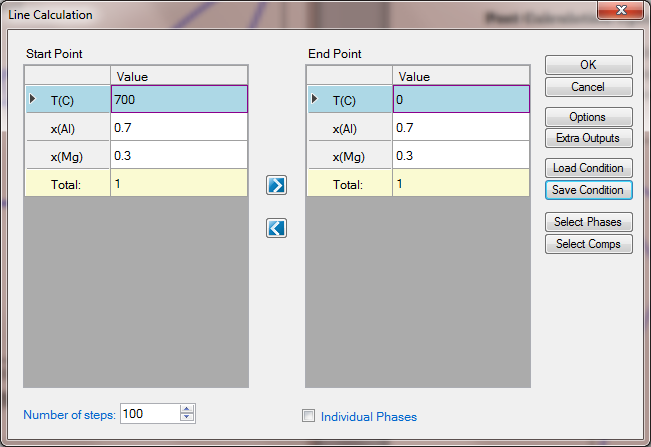
1D calculation from 700°C to 0°C for alloy with 70 at% Al and 30 at% Mg
Post Calculation Operation:
- Add legend to the graph following the procedure in Pandat User’s Guide 2.3.3;
- Change graph appearance following the procedure in Pandat User’s Guide 2.3.1;
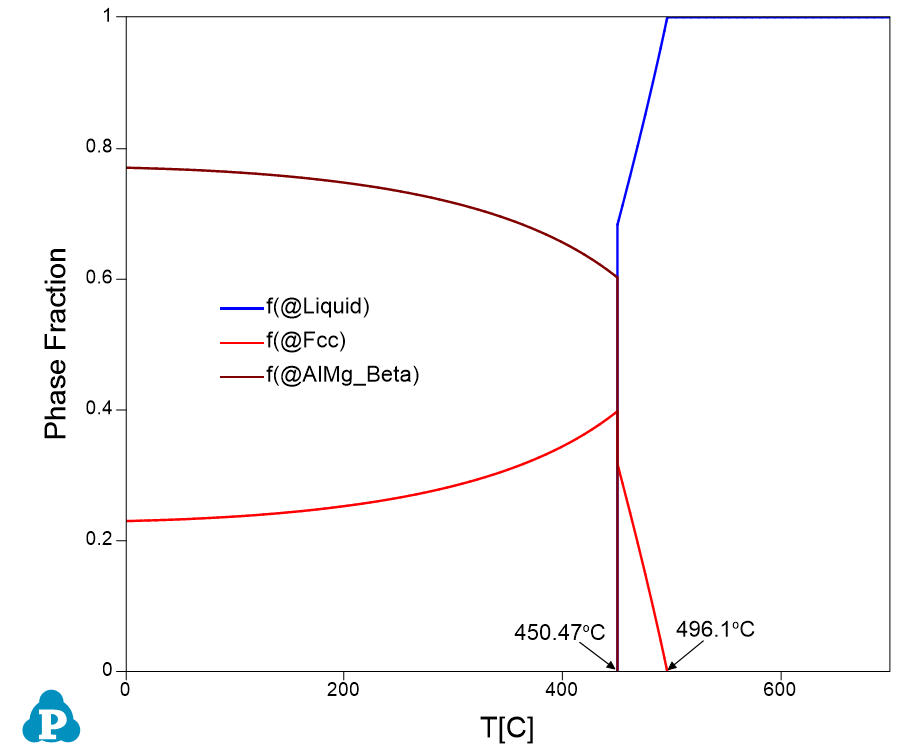
Phase fraction variation as a function of temperature
Information obtained from this calculation:
- Liquid is the only stable phase at high temperature until 496.1°C, which is the liquidus temperature;
- Below liquidus, Fcc phase forms and its fraction increases while that of the Liquid phase decreases until the eutectic temperature 450.47°C;
- At eutectic temperature 450.47°C, Liquid is disappeared (drops to 0% from 68.3%), fraction of the AlMg_Beta phase jumps from 0% to 60.21% and that of the Fcc phase jumps from 31.7% to 39.79%;
- Details on the fraction of each phase as a function of temperature can be found in the Default table as shown in right-hand figure
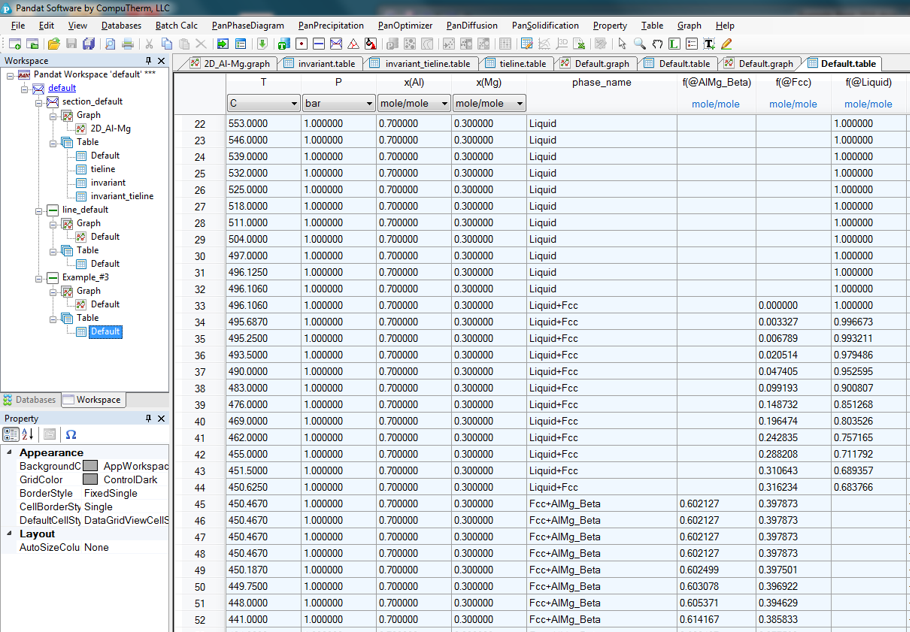
Default table showing details of phase fraction variation as a function of temperature