Solidification Simulation by Scheil Model and Lever Rule
- Purpose: Learn to perform solidification simulation for a given alloy composition
- Module: PanPhaseDiagram
- Database: AlMgZn.tdb
Pandat has two models for solidification simulation, one based on Lever rule and the other Scheil model. Lever rule assumes infinite slow cooling so that equilibrium is reached at every step of solidification. Scheil model assumes fast cooling and fast diffusion in the liquid so that liquid maintains uniform composition, no diffusion in the solid and local equilibrium is reached between liquid and solid at the interface. In this example we will perform two solidification simulations using the two models for an alloy with 40 at% of Al, 50 at% of Mg and 10 at% of Zn. We will then compare the simulation results by plotting them on the same plot.
Calculation Method 1:
- • From menu bar click Batch Calc-> Batch Run, select Example_#1.8.pbfx
Calculation Method 2:
- Load AlMgZn.tdb following the procedure in Pandat User’s Guide 3.2.1;
- Perform solidification simulation following the procedure in Pandat User’s Guide 3.3.6;
- Set Calculation Condition as shown in the right-hand figure, check “Scheil” for the first calculation and “Lever” for the second calculation
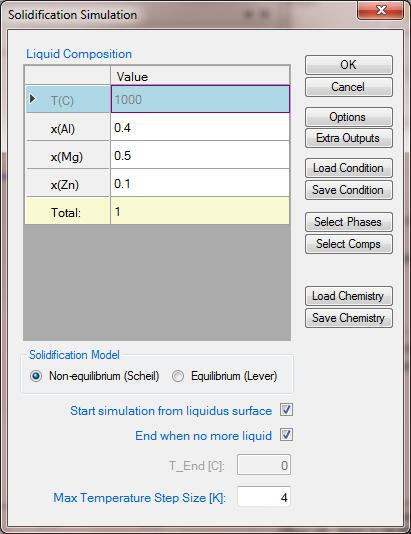
Figure 1. Input the alloy composition for solidification simulation
Post Calculation Operation:
- Change graph appearance following the procedure in Pandat User’s Guide 2.3.1;
- Add text and arrow on the plot following the procedure in Pandat User’s Guide 2.3.3;
Information obtained from this calculation:
- Figure 2 shows the fraction of solid as a function of temperature from Scheil simulation. Solidification starts at 457°C and ends at 336.9°C, the freezing range is 120.1°C;
- The primary solidified phase is T_AlMgZn phase, AlMg_Gamma starts to solidify at 447.5°C and Hcp starts to solidify at 351.8oC. Put the cursor on the line segment, a tool tip will pop out showing the phase(s) solidified in that composition and temperature range. Press ‘F2’ to label it;
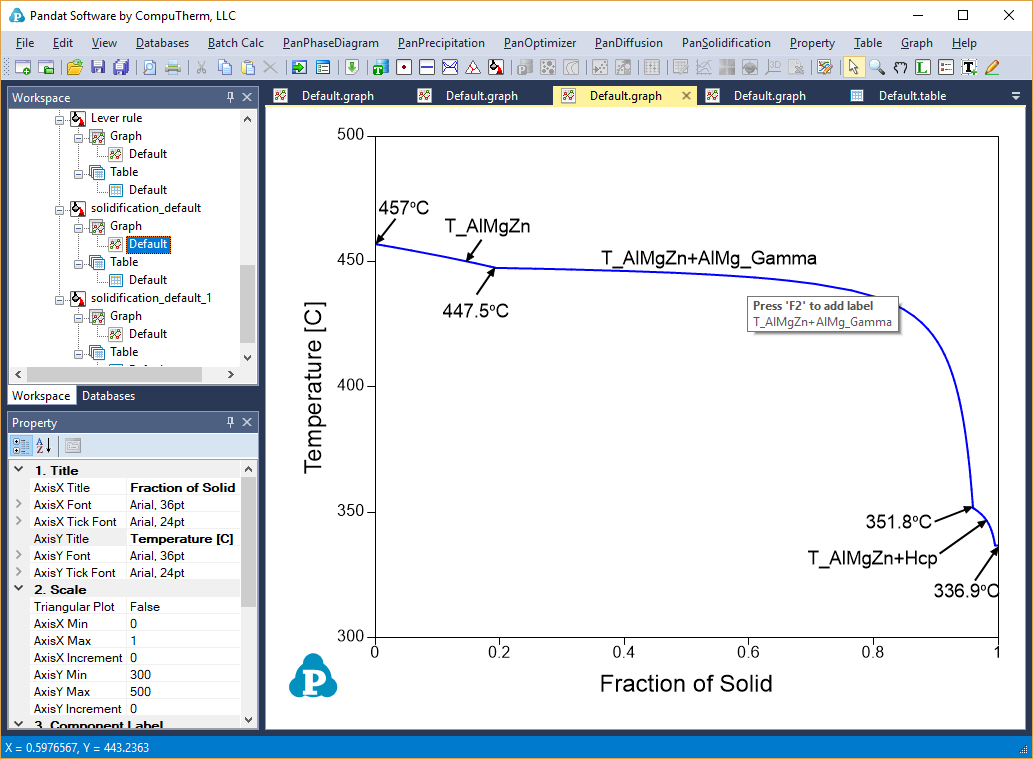
Figure 2. Fraction of solid as a function of temperature from Scheil simulation
- Detail information for the simulation, such as solidification start temperature for a certain phase, the total fraction of each solid at different temperatures, latent heat, and total heat evolved can be found in the Default Table as shown in Figure 3
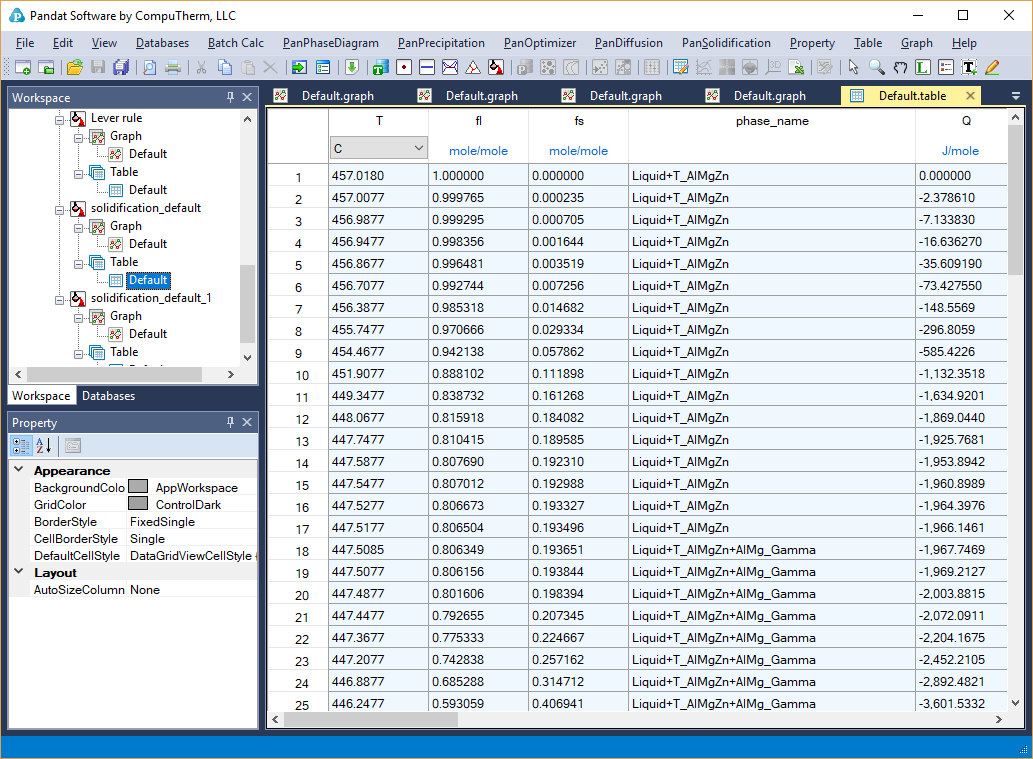
Figure 3. Detailed solidification information listed in the Default table
- Certain properties can be selected from the Default table and plotted. Figure 4 shows the fraction of each solid phase as a function of temperature,
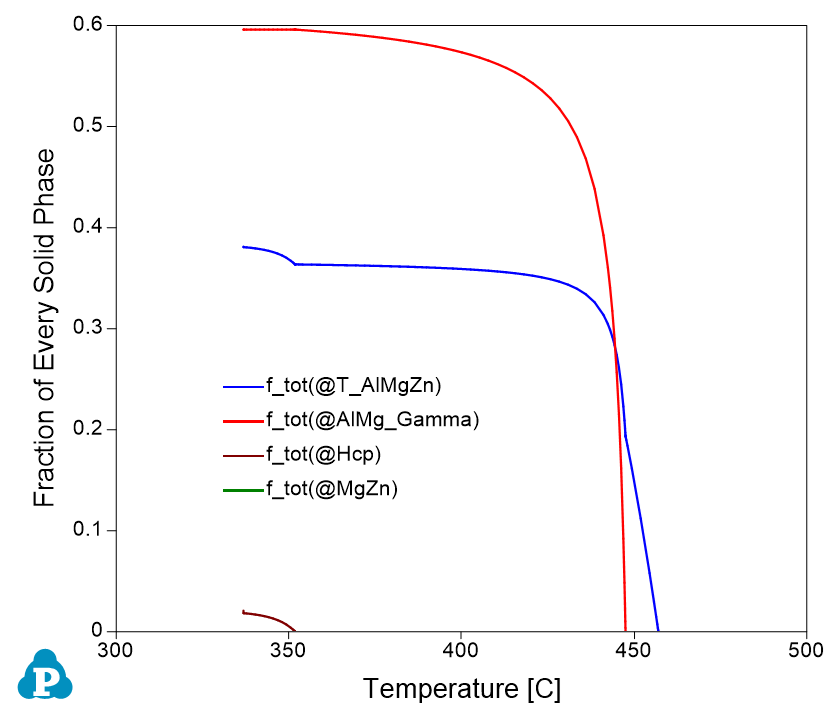
Figure 4. Fraction of each solid phase as a function of temperature
- Figure 5 shows the Latent heat and total heat evolution as a function of temperature
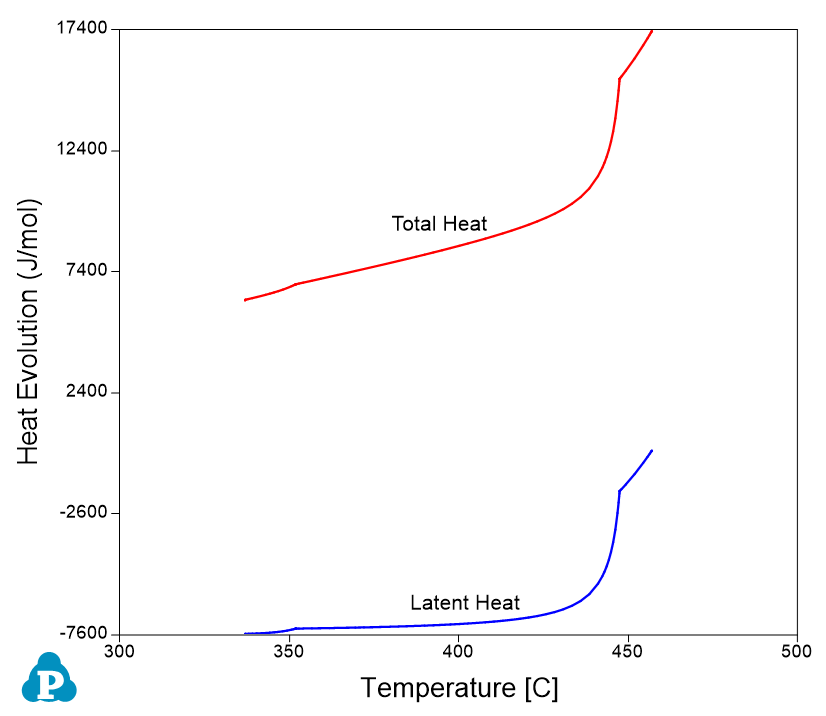
Figure 5. Heat evolution as a function of temperature
- Figure 6 shows the lever rule simulation which follows equilibrium calculation. It therefore shows a very narrow solidification range, starting from 457°C and ending at 437°C;
- Only two phases solidified from lever rule simulation, i.e., T_AlMgZn phase and AlMg_Gamma phase;
- Details on the fraction of solid phase, heat evolution, and so on can also be found in the Default table;
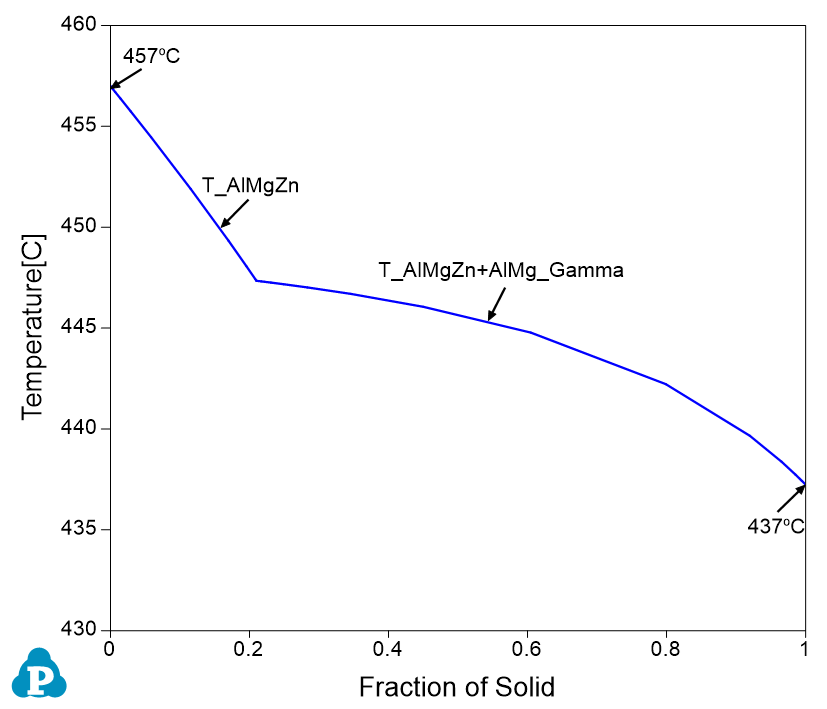
Figure 6. Fraction of solid as a function of temperature by Lever rule simulation
- Figure 7 shows the overlapped plots from Scheil simulation and Lever rule simulation. To merge two plots together, we first open the plot from Lever rule simulation as shown in Figure 6, right click the mouse and choose “Copy Data”, then open the plot from Scheil simulation as shown in Figure 2, right click the mouse and choose “Paste Data”. The two plots from Lever rule simulation and Scheil simulation are merged in the same diagram as shown in Figure 7;
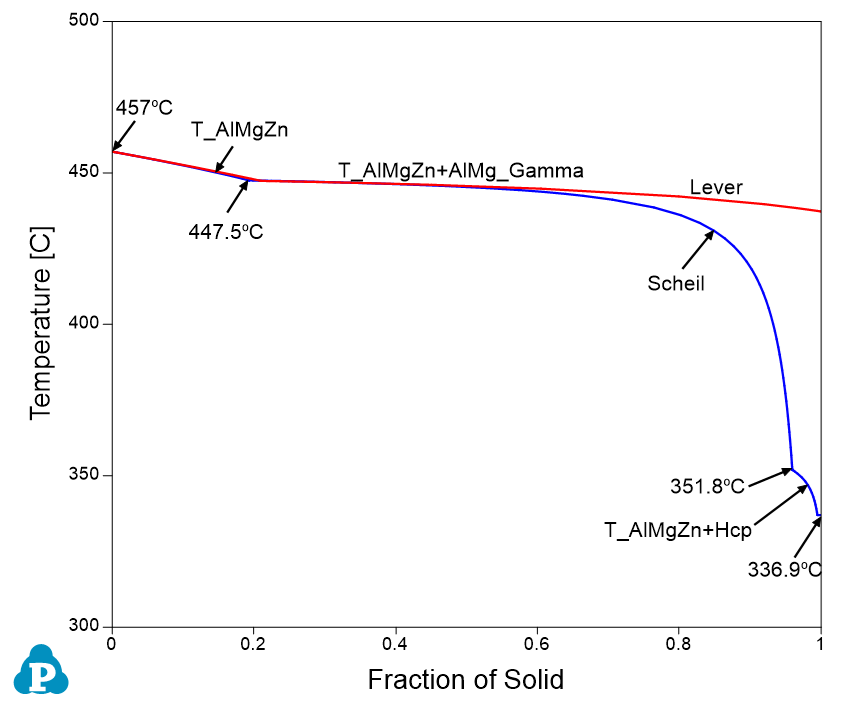
Figure 7. Merge the Scheil and Lever simulation results together