Table Operation in Pandat
1. Pandat table introduction
In Pandat workspace, the calculated results data are stored in tables. In addition to the most popular default table, there are also other tables for special properties, such as tie-line table and invariant reaction table for phase diagram, isothermal line table for in liquidus projections and so on.
2. Add or edit a table
Right click on the “table” in the workspace, then you can “Add a new table” as shown in Figure 1a. Right click on a result table, for example, the “default” table, then you can “Edit Table columns” as shown in Figure 1b. After you select the “Table” or a “default” table, you can also add or edit a table by click the table icon in the toolbor or from the menu “Table -> Add or Edit a Table”.
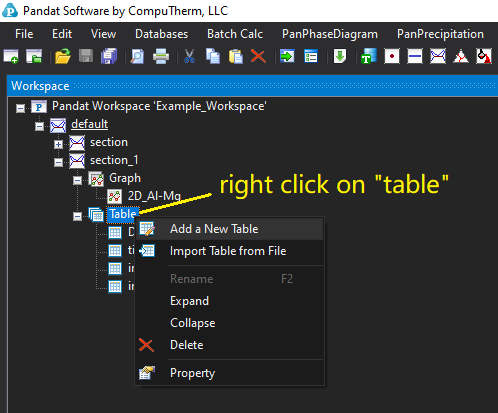
Figure 1a. Add a new table
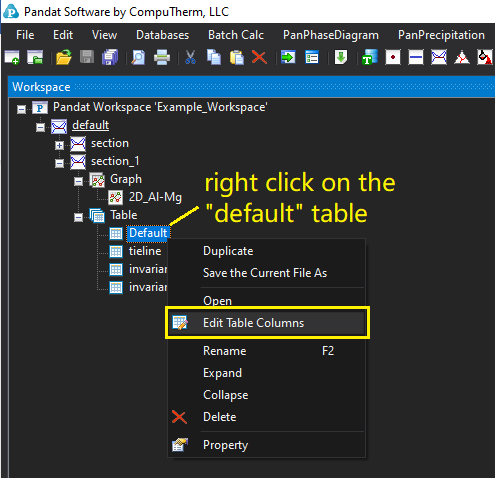
Figure 1b. Edit table columns
After you click the “add a new table” or “Edit Table columns”, the “Table Editor” window will popup. In this window, you can edit or add you column properties. You can drag the property from the left side to the right side, or you can also directly type in the properties from the right side columns. Pandat table can also do some typical math function calculations, after you press “Ctrl” + “M”, the available math functions will be shown.
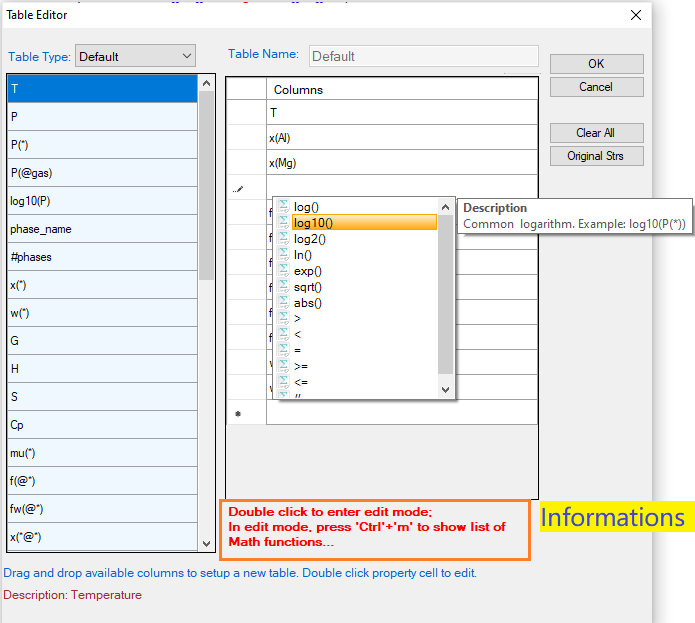
Figure 2. Edit the properties of the columns in the Table editor.
In the Table Type option, besides the “Default”, there are some other types of table data, such as tie-line, invariant etc.
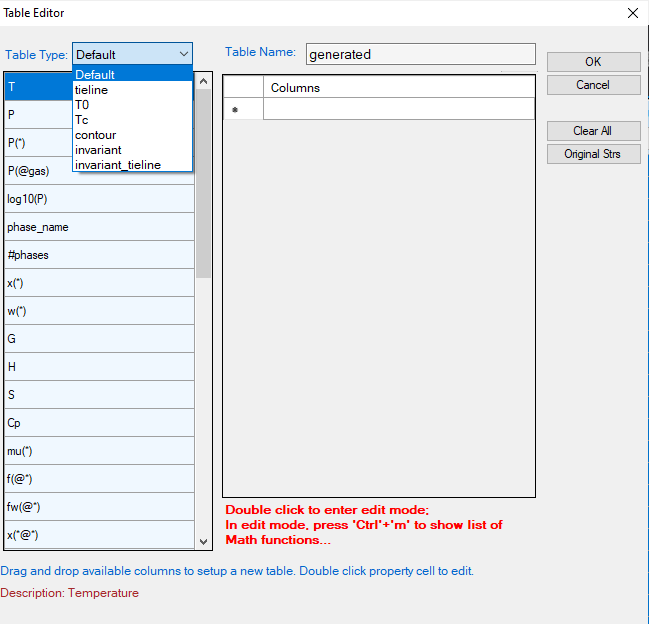
Figure 3. Different table types in the table editor.
3. Plot diagrams from table
Using the data in the tables, you can plot different types of diagrams. For example, here, first selected w(Mg) column set composition as X-axis, hold the control key on the keyboard, and then click T column as temperature as the Y-axis. Then click the “create a new diagram” icon ![]() in the toolbar, a new Al-Mg phase diagram will be plotted.
in the toolbar, a new Al-Mg phase diagram will be plotted.
Pandat can also plot other types of 3D diagrams, please see the page How to plot 3D diagrams.
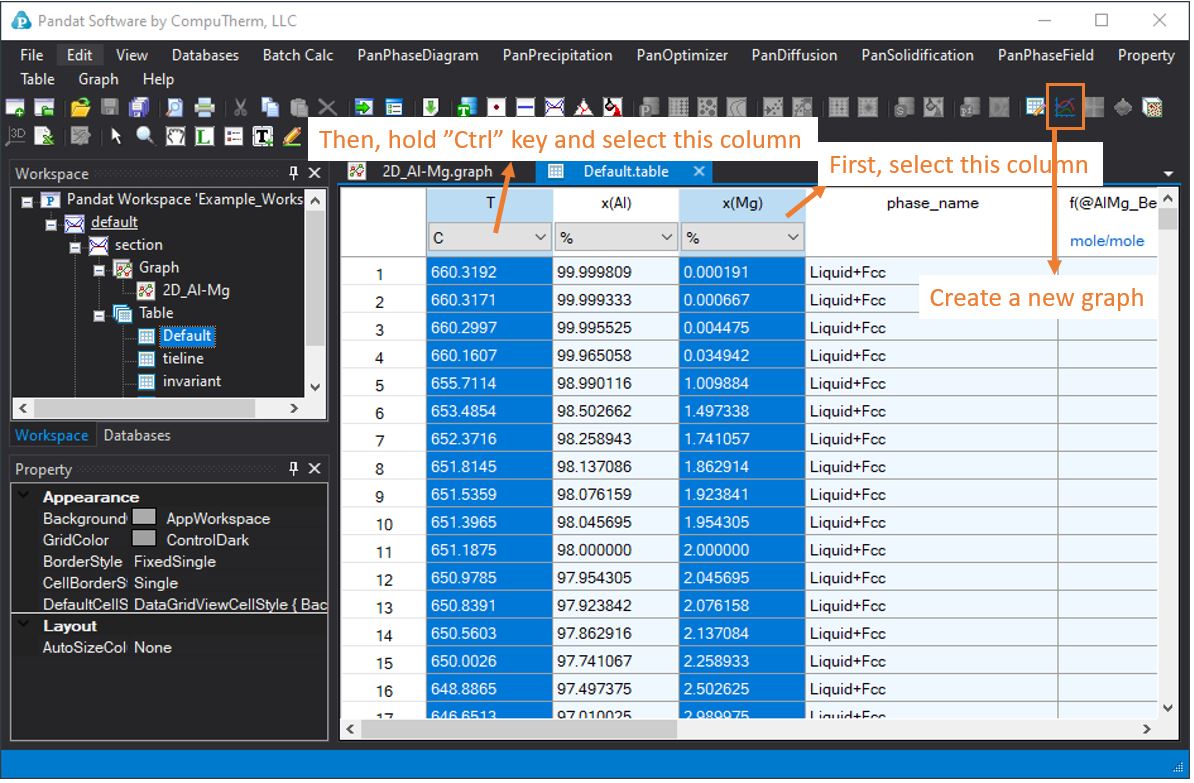
Figure 4. Select data from the table for plotting.
4. Export table data
In Pandat, the calculated table data can be easily exported to excel file or txt file. After you open the table file, then click the excel ![]() icon or from the menu “Table -> Export to Excel” or “Table -> Export to a Text File”, then the table data will be exported to an excel file or saved as a text file.
icon or from the menu “Table -> Export to Excel” or “Table -> Export to a Text File”, then the table data will be exported to an excel file or saved as a text file.
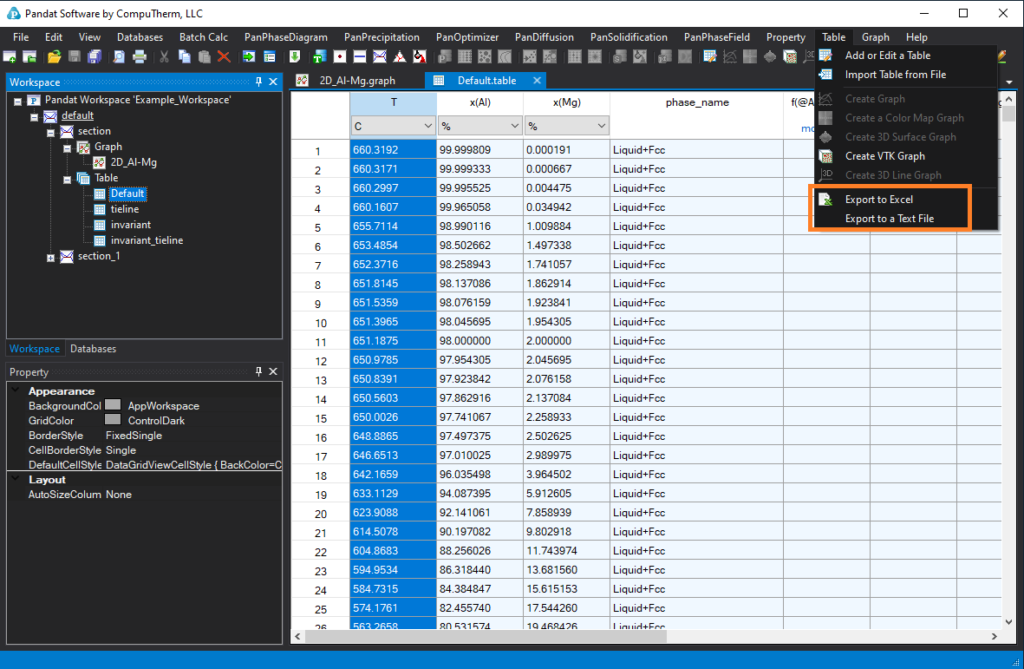
Figure 5. Export data to excel or text file from Table menu.
5. Import table from file
You can import data by click menu “Table -> import table from file” as shown in Figure 5. You can also right click on the “table” icon, then choose the “import table from file” as shown in Figure 1. Then a window will pop up to select the file you want to be imported. The data format for the import data file is the same as the data format from the output table data file, as shown in Figure 6. The first row is the quantity, the second row is the unit, after that are the data values. After the data have been successfully imported, a new table will be shown in the workspace under the table group. Then you can use these data for plotting in Pandat.
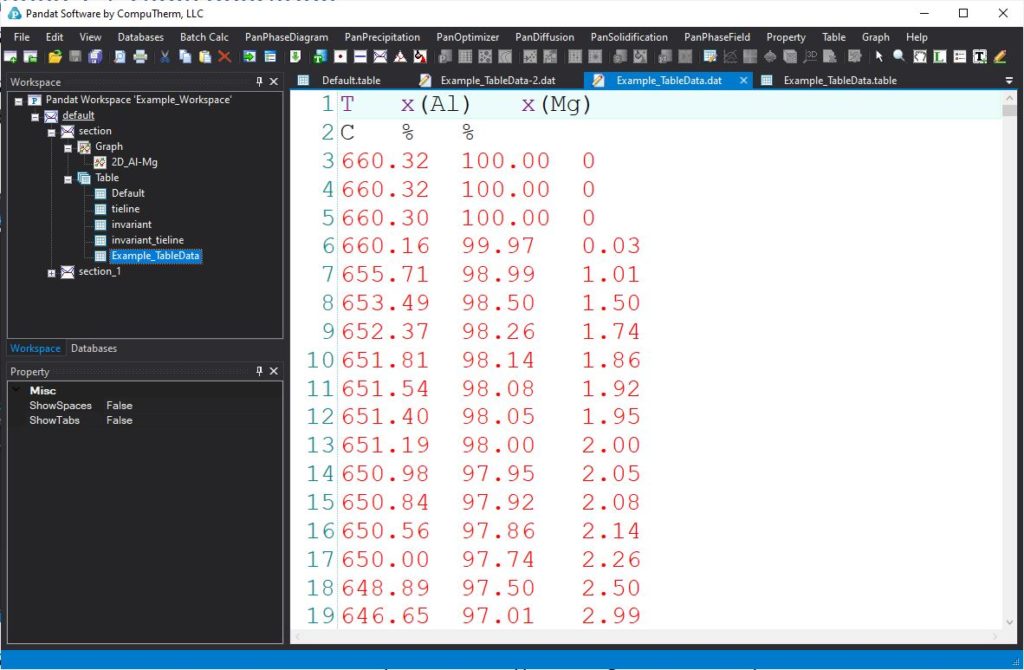
Figure 6. Example of a text file for table import.