Superimpose external data on the calculated diagram
Here we use Al-Zn phase diagram as an example to illustrate how to add experimental data on a calculated phase diagram. In PandatTM , there are two easy ways for users to superimpose the external data on the results from PandatTM calculations for comparison.
Method 1. Copy data from excel file
Step 1. Prepare your external data, either experimental data or calculated data from other software, in an excel file. Here we have experimental data of Al-Zn system as shown in Figure 1. The first row is reserved for property name, and the second row is for the unit of the property. The data start from the third row. Select the two columns of the experimental data and click copy.
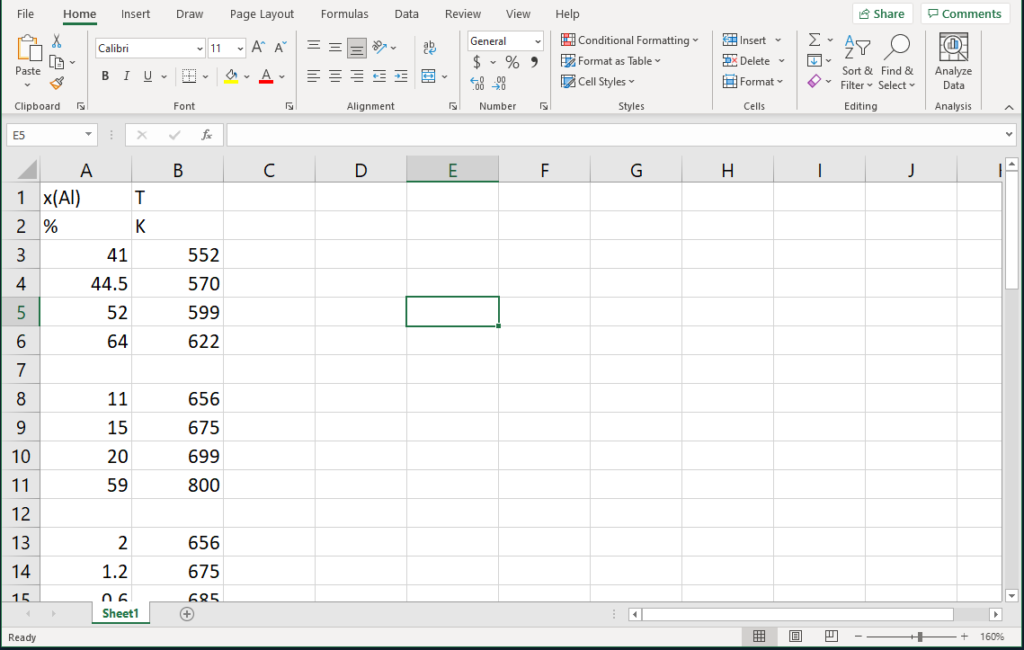
Figure 1. The excel file format contains the external data
Step 2. Open the calculated Al-Zn phase diagram graph. Then click menu “Graph -> Edit plots” or “Edit plots” icon ![]() on the toolbar. On the popped-out “setup plot”dialog, check the clipboard, the property names from the excel file will be listed in the Window named as “available columns”. Select x(Al) and drag it into the field below the X Axis. Then select “T” and drag it into the field for Y axis. Then Click OK.
on the toolbar. On the popped-out “setup plot”dialog, check the clipboard, the property names from the excel file will be listed in the Window named as “available columns”. Select x(Al) and drag it into the field below the X Axis. Then select “T” and drag it into the field for Y axis. Then Click OK.
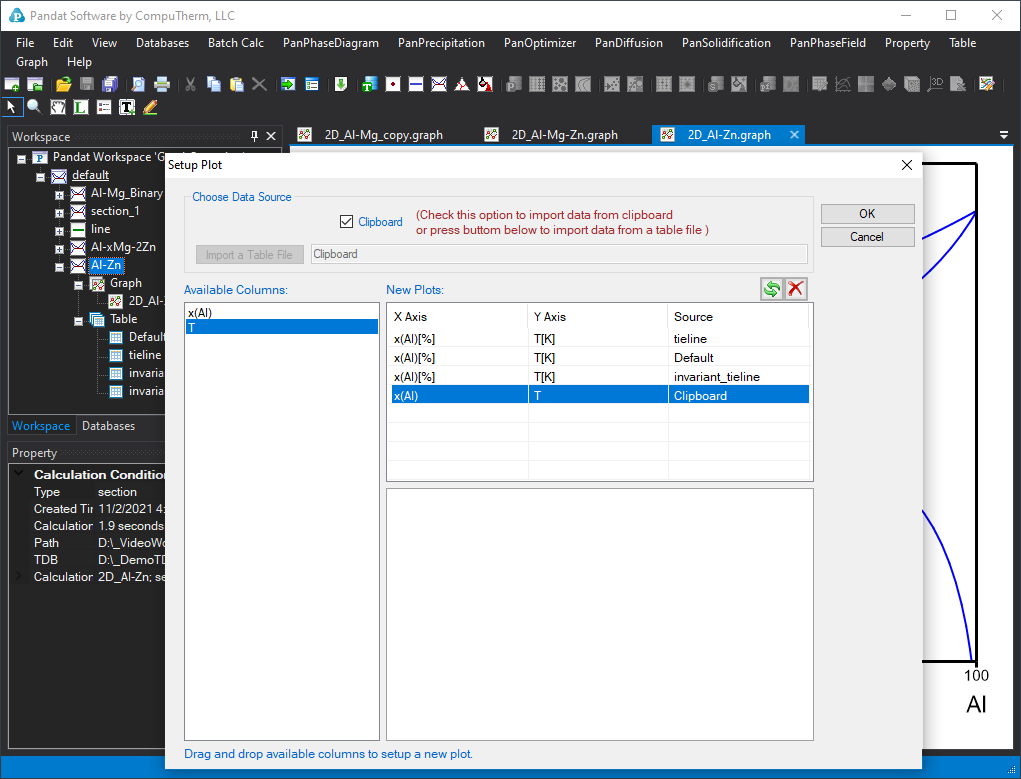
Figure 2. Setup Plot interface
The phase diagram with experimental data superimposed is shown in Figure 3.
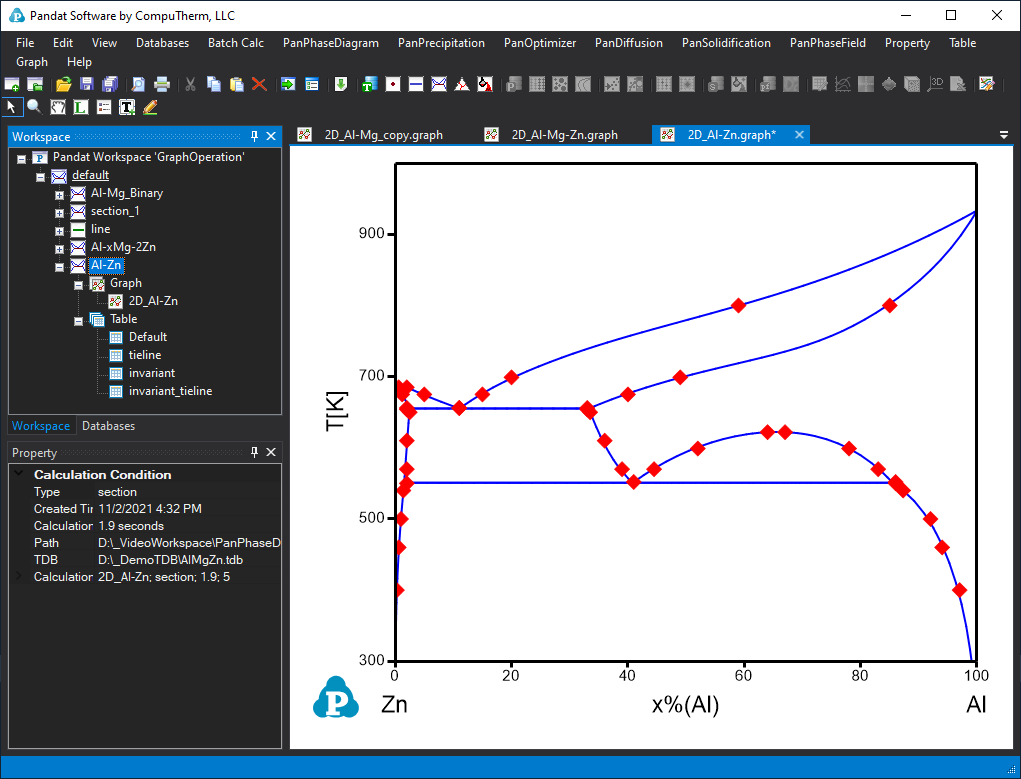
Figure 3. Calculated phase diagram together with the superimposed experimental data.
Method 2. Import the external data to Pandat table
Step 1. Save the experimental data prepared in Excel as a text file with extension name .txt, or copy the data from excel file into a text file.
Step 2. In Pandat workspace, click the Table on the menu bar and select Import table from file. Select the text file we just prepared. Refer to the page Table option 5: Import table from file on how to import these data for detailed description.
Step 3. Add the data from the imported table on the Al-Zn phase diagram. Click menu “Graph -> Edit plots” or “Edit plots” icon on the toolbar. On the popped-out “setup plot”dialog, then click “import” a table file and select the imported table similar to the procedure shown in Figure 3. Please refer to the page Merge two calculated phase diagrams together for detail on how to add a table data on a diagram.